# @miyax/ganttjs
> An open source gantt chart for the web
Latest version **1.3.0** (published 2025-10-14) · MIT license · 0 weekly downloads
## Install
```sh
npm install @miyax/ganttjs
pnpm add @miyax/ganttjs
yarn add @miyax/ganttjs
bun add @miyax/ganttjs
```
## Health
**Score 55/100 (C)** — status: stable.
Positive: has types; esm support; no vulnerabilities.
Warnings: low downloads.
## Facts
| | |
|---|---|
| Version | 1.3.0 |
| Published | 2025-10-14 |
| First published | 2023-08-22 |
| Weekly downloads | 0 |
| License | MIT |
| TypeScript types | bundled |
| Module format | ESM + CommonJS |
| Dependencies | 0 |
| Unpacked size | 19.8 KB |
| Known vulnerabilities | 0 |
| Install scripts | no |
| GitHub stars | 3 |
| Author | José Antonio Sánchez Román |
| Maintainers | xerifandtomas |
| Keywords | gantt, gantt chart, simple gantt, project timeline, chart, browser, web, miyax, miyax gantt |
## Links
- npm: https://www.npmjs.com/package/@miyax/ganttjs
- Repository: https://github.com/xerifandtomas/miyax-gantt-js
- Homepage: https://github.com/xerifandtomas/miyax-gantt-js#readme
- Issues: https://github.com/xerifandtomas/miyax-gantt-js/issues
- npm.io page: https://npm.io/package/@miyax/ganttjs
## Alternatives
- [d3-force-3d](https://npm.io/package/d3-force-3d.md) — 1.0M weekly downloads
- [ng2-charts](https://npm.io/package/ng2-charts.md) — 486.8K weekly downloads
- [@arcgis/core](https://npm.io/package/@arcgis/core.md) — 257.8K weekly downloads
- [react-sparklines](https://npm.io/package/react-sparklines.md) — 249.3K weekly downloads
- [react-native-gifted-charts](https://npm.io/package/react-native-gifted-charts.md) — 182.3K weekly downloads
## Recent versions
- 1.3.0 (latest) — 2025-10-14
- 1.2.0 — 2025-01-27
- 1.1.3 — 2023-08-25
- 1.1.2 — 2023-08-23
- 1.1.1 — 2023-08-23
- 1.1.0 — 2023-08-23
- 1.0.10 — 2023-08-23
- 1.0.9 — 2023-08-23
- 1.0.8 — 2023-08-23
- 1.0.7 — 2023-08-23
- 1.0.6 — 2023-08-22
- 1.0.5 — 2023-08-22
- 1.0.4 — 2023-08-22
- 1.0.3 — 2023-08-22
- 1.0.2 — 2023-08-22
- … 2 more at https://npm.io/package/@miyax/ganttjs/versions
## README
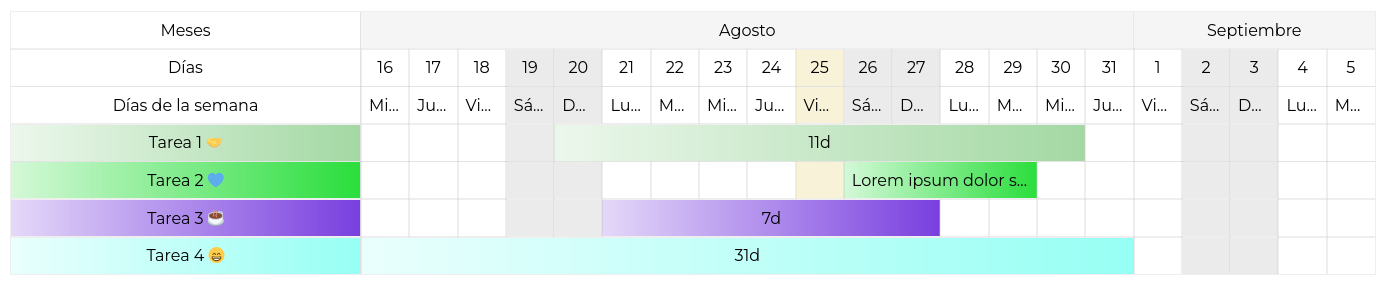
# Miyax Gantt Chart
An open source gantt chart for the web
----
## Installation
```bash
npm i @miyax/ganttjs
```
or
```bash
yarn add @miyax/ganttjs
```
## Usage
Create a html element
```html
```
```javascript
import { GanttChart, ES } from '@miyax/ganttjs'
import '@miyax/ganttjs/src/theme/default.css'
// Define the tasks
const tasks = [
{
id: "1",
name: "Hello world!!",
start: new Date("2023/08/09"),
end: new Date("2023/08/15"),
color: "#CC8888",
description: "Lorem ipsum dolor sit amet consectetur adipisicing elit.",
}
]
// Define the element
const ganttChartHtmlElement = document.getElementById("gantt-chart")
// Define the period
const startGanttChart = new Date("2023/08/01")
const endGanttChart = new Date("2023/08/10")
// Create a new gantt chart
const gantt = new GanttChart() // or new GanttChart(ganttChartHtmlElement)
// Basic
gantt
.element(ganttChartHtmlElement) // set the element
.period(startGanttChart, endGanttChart) // show the period from 2023/08/01 to 2023/08/31
.tasks(tasks) // add the tasks
.render() // render the gantt chart
// All options
gantt
.element(ganttChartHtmlElement) // set the element
.period(startGanttChart, endGanttChart) // show the period from 2023/08/01 to 2023/08/31
// .todayTo(2) // show the period from today to 2 days after
.tasks(tasks) // add the tasks
.widthHeader('350px') // set the width of the header, default is 150px
.withWeekDays() // show the week days
.withMonthDay() // show the month day
.withYearMonths() // show the year months
.withTime() // show the duration of the tasks
.showHeaders(false) // disable or enable the headers, default is true
.i18n(ES) // set the language, default is EN
.render() // render the gantt chart
// Update the gantt chart
const newTask = {
id: "2",
name: "¡¡Hola mundo!!",
start: new Date("2023/08/09"),
end: new Date("2023/08/15"),
color: "#88CC88",
}
tasks.push(newTask)
gantt
.task(tasks) // add the tasks
.period(new Date("2023/08/01"), new Date("2023/08/31")) // show the period from 2023/08/01 to 2023/08/31
.render() // update the gantt chart
```
## Events
```javascript
// Selected task event
ganttChartId.addEventListener("selected", (e) => console.log('Task selected', e.detail))
```
## Example VUE
Sandbox example: https://codesandbox.io/s/dawn-browser-k66vzr?file=/src/App.vue
```html
{{ lastSelectedTask }}
```
## I18n example
Createa new object with the translations
```js
const ES = {
daysOfWeek: {
monday: 'Lunes',
tuesday: 'Martes',
wednesday: 'Miércoles',
thursday: 'Jueves',
friday: 'Viernes',
saturday: 'Sábado',
sunday: 'Domingo',
},
monthsOfYear: {
january: 'Enero',
february: 'Febrero',
march: 'Marzo',
april: 'Abril',
may: 'Mayo',
june: 'Junio',
july: 'Julio',
august: 'Agosto',
september: 'Septiembre',
october: 'Octubre',
november: 'Noviembre',
december: 'Diciembre',
},
monthsTitle: 'Meses',
daysTitle: 'Días',
dayOfweekTitle: 'Días de la semana',
}
```
---
_Source: https://npm.io/package/@miyax/ganttjs · Machine-readable twin of the npm.io package page. Health data is recomputed on every publish._