# @syncfusion/ej2-react-charts
> Feature-rich chart control with built-in support for over 25 chart types, technical indictors, trendline, zooming, tooltip, selection, crosshair and trackball. for React
Latest version **35.1.37** (published 2026-09-29) · SEE LICENSE IN license license · 0 weekly downloads
## Install
```sh
npm install @syncfusion/ej2-react-charts
pnpm add @syncfusion/ej2-react-charts
yarn add @syncfusion/ej2-react-charts
bun add @syncfusion/ej2-react-charts
```
## Health
**Score 60/100 (C)** — status: active.
Positive: esm support; no vulnerabilities; recently updated; high maintenance score.
Warnings: low downloads; no types.
## Facts
| | |
|---|---|
| Version | 35.1.37 |
| Published | 2026-09-29 |
| First published | 2017-08-03 |
| Weekly downloads | 0 |
| License | SEE LICENSE IN license |
| TypeScript types | none |
| Module format | ESM + CommonJS |
| Dependencies | 3 |
| Unpacked size | 734.4 KB |
| Known vulnerabilities | 0 |
| Install scripts | no |
| GitHub stars | 397 |
| Author | Syncfusion Inc. |
| Maintainers | syncfusionorg, essentialjs2, syncfusion-javascript |
| Keywords | react, reactjs, react-charts, react-graph, react-stock-chart, react-accumulation-chart, react-rangenavigator, react-rangeselector, react-sparkline, react-sparkline-chart, react-smith-chart, react-bullet-chart, react-bullet-graph, react-chart3d, react-circularchart3d, react-sankey |
## Links
- npm: https://www.npmjs.com/package/@syncfusion/ej2-react-charts
- Repository: https://github.com/syncfusion/ej2-react-ui-components
- Homepage: https://www.syncfusion.com/react-components
- Issues: https://github.com/syncfusion/ej2-react-ui-components/issues
- npm.io page: https://npm.io/package/@syncfusion/ej2-react-charts
## Dependencies (3)
- [@syncfusion/ej2-base](https://npm.io/package/@syncfusion/ej2-base.md) ~35.1.37
- [@syncfusion/ej2-charts](https://npm.io/package/@syncfusion/ej2-charts.md) 35.1.37
- [@syncfusion/ej2-react-base](https://npm.io/package/@syncfusion/ej2-react-base.md) ~35.1.37
## Alternatives
- [mobx-react](https://npm.io/package/mobx-react.md) — 2.8M weekly downloads
- [rc-tree](https://npm.io/package/rc-tree.md) — 2.6M weekly downloads
- [@react-oauth/google](https://npm.io/package/@react-oauth/google.md) — 1.3M weekly downloads
- [@wagmi/connectors](https://npm.io/package/@wagmi/connectors.md) — 877.0K weekly downloads
- [vee-validate](https://npm.io/package/vee-validate.md) — 836.4K weekly downloads
## Recent versions
- 35.1.37 (latest) — 2026-09-29
- 21.1.42 (beta) — 2023-06-28
- 34.2.8 — 2026-09-15
- 34.2.6 — 2026-09-01
- 34.2.5 — 2026-08-25
- 34.2.4 — 2026-08-18
- 34.2.3 — 2026-08-11
- 34.2.2 — 2026-08-05
- 34.1.33 — 2026-07-28
- 34.1.29 — 2026-07-06
- 33.2.15 — 2026-06-23
- 33.2.13 — 2026-06-16
- 33.2.12 — 2026-06-09
- 33.2.10 — 2026-06-02
- 33.2.8 — 2026-05-26
- … 363 more at https://npm.io/package/@syncfusion/ej2-react-charts/versions
## README
# React Charts Components
The [React Chart](https://www.syncfusion.com/react-components/react-charts?utm_source=npm&utm_medium=listing&utm_campaign=react-charts-npm) component is a well-crafted charting component for visualizing data with 50+ charts and graphs, ranging from line to financial types. It can bind data from datasource such as array of JSON objects, `OData web services` or [DataManager](https://ej2.syncfusion.com/react/documentation/data/data-binding/). All chart elements are rendered using Scalable Vector Graphics (SVG).
> **Using this package with an AI coding agent**
>
> Before generating Syncfusion code, ask your AI coding agent to run the Syncfusion setup using the following prompt:
>
> ```text
> Set up this project for Syncfusion before generating code. Fetch
> and follow the official instructions at https://ai.syncfusion.com,
> then report the detected platform, installed skill pack, MCP
> status, and any required licensing action.
> ```
> The setup detects your project’s platform and loads the appropriate Syncfusion skill pack. No Syncfusion account or MCP key is required to install or read Syncfusion agent skills.
>
> **Platform reference:** [https://ai.syncfusion.com/react/llms.txt](https://ai.syncfusion.com/react/llms.txt)
## What's Included in the React Charts Package
The [React Charts](https://www.syncfusion.com/react-components/react-charts?utm_source=npm&utm_medium=listing&utm_campaign=react-charts-npm) package includes the following list of components.
### React Chart
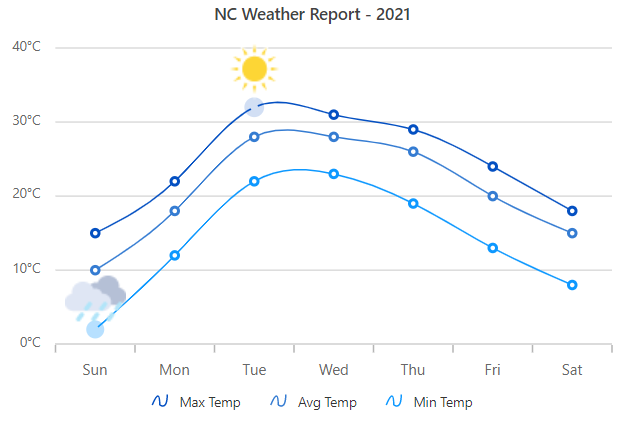
The [React Chart Component](https://www.syncfusion.com/react-components/react-charts) is a feature-rich chart component with built-in support for over 50 chart types, technical indictors, trendline, zooming, tooltip, selection, crosshair and trackball.
Getting started .
Online demos .
Learn more
#### Key Features
* Chart types: Supports 50+ interactive chart types starting from line to financial chart. Few chart types include:
* [React Area Chart](https://www.syncfusion.com/react-components/react-charts/chart-types/area-chart?utm_source=npm&utm_medium=listing&utm_campaign=react-area-charts-npm)
* [React Bar Chart](https://www.syncfusion.com/react-components/react-charts/chart-types/bar-chart?utm_source=npm&utm_medium=listing&utm_campaign=react-bar-charts-npm)
* [React Line Chart](https://www.syncfusion.com/react-components/react-charts/chart-types/line-chart?utm_source=npm&utm_medium=listing&utm_campaign=react-line-charts-npm)
* [React Spline Chart](https://www.syncfusion.com/react-components/react-charts/chart-types/spline-chart?utm_source=npm&utm_medium=listing&utm_campaign=react-spline-charts-npm)
* [React Bubble Chart](https://www.syncfusion.com/react-components/react-charts/chart-types/bubble-chart?utm_source=npm&utm_medium=listing&utm_campaign=react-bubble-charts-npm)
* [React Scatter Chart](https://www.syncfusion.com/react-components/react-charts/chart-types/scatter-chart?utm_source=npm&utm_medium=listing&utm_campaign=react-scatter-charts-npm)
* [React Step Chart](https://www.syncfusion.com/react-components/react-charts/chart-types/stepline-chart?utm_source=npm&utm_medium=listing&utm_campaign=react-step-charts-npm)
* [React Polar Chart](https://www.syncfusion.com/react-components/react-charts/chart-types/polar-chart?utm_source=npm&utm_medium=listing&utm_campaign=react-polar-npm)
* [React Radar Chart](https://www.syncfusion.com/react-components/react-charts/chart-types/radar-chart?utm_source=npm&utm_medium=listing&utm_campaign=react-radar-npm)
* [React Range Chart](https://www.syncfusion.com/react-components/react-charts/chart-types/range-area-chart?utm_source=npm&utm_medium=listing&utm_campaign=react-range-charts-npm)
* [React Stacked Chart](https://www.syncfusion.com/react-components/react-charts/chart-types/range-area-chart?utm_source=npm&utm_medium=listing&utm_campaign=react-stacked-charts-npm)
* [React Box Plot Chart](https://www.syncfusion.com/react-components/react-charts/chart-types/box-and-whisker-chart?utm_source=npm&utm_medium=listing&utm_campaign=react-charts-npm)
* [React Histogram Chart](https://www.syncfusion.com/react-components/react-charts/chart-types/histogram-chart?utm_source=npm&utm_medium=listing&utm_campaign=react-charts-npm)
* [React Financial Chart](https://www.syncfusion.com/react-components/react-charts/chart-types/stock-chart?utm_source=npm&utm_medium=listing&utm_campaign=react-stock-charts-npm)
* [Data binding](https://ej2.syncfusion.com/react/demos/?utm_source=npm&utm_campaign=chart#/material/chart/local-data): Bind the Chart component with an array of JSON objects or DataManager. Other than chart series, data label and tooltip can also bound to your data.
* [Axis types](https://ej2.syncfusion.com/react/demos/?utm_source=npm&utm_campaign=chart#/material/chart/numeric-axis): Supports multiple axes, and able to plot different data such as numbers, datetime, logarithmic and string.
* [Rendering modes](https://ej2.syncfusion.com/react/documentation/chart/render-methods/): Supports two type of rendering - SVG and Canvas. By default chart rendered in SVG, You can easily switch between the two simple configuration.
* [Data label](https://ej2.syncfusion.com/react/demos/?utm_source=npm&utm_campaign=chart#/material/chart/datalabel-template): Supports data label to annotate points with label to improve the readability of data.
* [Annotation](https://ej2.syncfusion.com/react/demos/?utm_source=npm&utm_campaign=chart#/material/chart/annotation): Provides support to mark any specific area of interest by adding custom element.
* [Zooming and panning](https://ej2.syncfusion.com/react/demos/?utm_source=npm&utm_campaign=chart#/material/chart/zoom): Provides options to visualize the data points under any region using rectangular selection, pinch, or mouse wheel zooming.
* [Crosshair & trackball](https://ej2.syncfusion.com/react/demos/?utm_source=npm&utm_campaign=chart#/material/chart/crosshair): Provides options to track data points closer to the mouse position or touch action.
* [Selection](https://ej2.syncfusion.com/react/demos/?utm_source=npm&utm_campaign=chart#/material/chart/selection): Allows you to select any data point or subset of points using selection feature.
* [Export](https://ej2.syncfusion.com/react/demos/?utm_source=npm&utm_campaign=chart#/material/chart/export): Provides the options to Export the chart to PDF, SVG and CSV formats.
* [RTL support](https://ej2.syncfusion.com/react/demos/?utm_source=npm&utm_campaign=chart#/material/chart/rtl): Provides a full-fledged right-to-left mode which aligns axis, tooltip, legend and data in the chart component from right to left.
* [Appearance](https://ej2.syncfusion.com/react/documentation/chart/chart-appearance/): Colors for the charts are picked by the built-in theme, but each element of the chart can be customized by simple configuration options.
* [Accessibility](https://ej2.syncfusion.com/react/documentation/chart/accessibility/?utm_source=npm&utm_medium=listing&utm_campaign=react-chart-npm#wai-aria): Designed to be accessible to users with disabilities, with features such as WAI-ARIA standard compliance and keyboard navigation to ensure that the chart can be effectively used with assistive technologies such as screen readers.
* [Localization](https://ej2.syncfusion.com/react/documentation/chart/localization/?utm_source=npm&utm_medium=listing&utm_campaign=react-chart-npm#localization): The Localization library enables you to adapt the default text content of the chart to fit the language and cultural preferences of your target audience.
### React Accumulation Chart
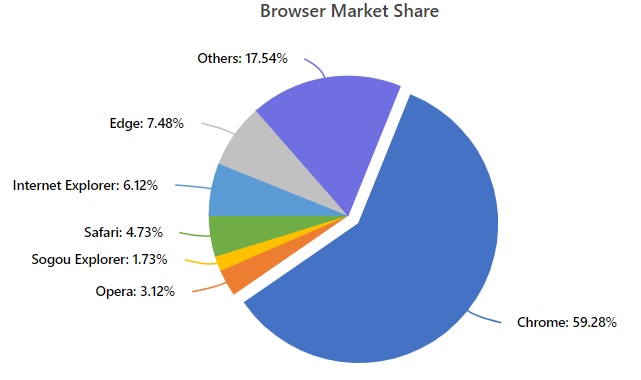
Built-in support for pie, doughnut, pyramid and funnel series type, to show the proportions and percentages between the categories.
Getting started .
Online demos .
Learn more
#### Key features
* Chart types: Supports Pie, Doughnut, Pyramid and Funnel charts.
* [React Pie Chart](https://www.syncfusion.com/react-components/react-charts/chart-types/pie-chart?utm_source=npm&utm_medium=listing&utm_campaign=react-pie-charts-npm)
* [React Doughnut Chart](https://www.syncfusion.com/react-components/react-charts/chart-types/donut-chart?utm_source=npm&utm_medium=listing&utm_campaign=react-donut-charts-npm)
* [React Pyramid Chart](https://www.syncfusion.com/react-components/react-charts/chart-types/pyramid-chart?utm_source=npm&utm_medium=listing&utm_campaign=react-pyramid-charts-npm)
* [React Funnel Chart](https://www.syncfusion.com/react-components/react-charts/chart-types/funnel-chart?utm_source=npm&utm_medium=listing&utm_campaign=react-funnel-charts-npm)
* [Smart labels](https://ej2.syncfusion.com/react/demos/?utm_source=npm&utm_campaign=chart#/material/chart/smartlabels): Supports arrangement of data labels smartly to avoid overlapping when the data point value falls in close range.
* [Grouping](https://ej2.syncfusion.com/react/demos/?utm_source=npm&utm_campaign=chart#/material/chart/grouping): Supports grouping of data points based on value and point count.
* [Semi-pie](https://ej2.syncfusion.com/react/demos/?utm_source=npm&utm_campaign=chart#/material/chart/semi-pie): Provides options to customize the start and end angle of the pie chart.
* [Legend](https://ej2.syncfusion.com/react/demos/?utm_source=npm&utm_campaign=chart#/material/chart/pie-legend): Provides options to display additional information about the points with the help of legend.
* [Tooltip](https://ej2.syncfusion.com/react/demos/?utm_source=npm&utm_campaign=chart#/material/chart/default-pie): Provides great user experiance by including a set of interactive features such as tooltip, drill-down, events, and selection.
### React Stock Chart
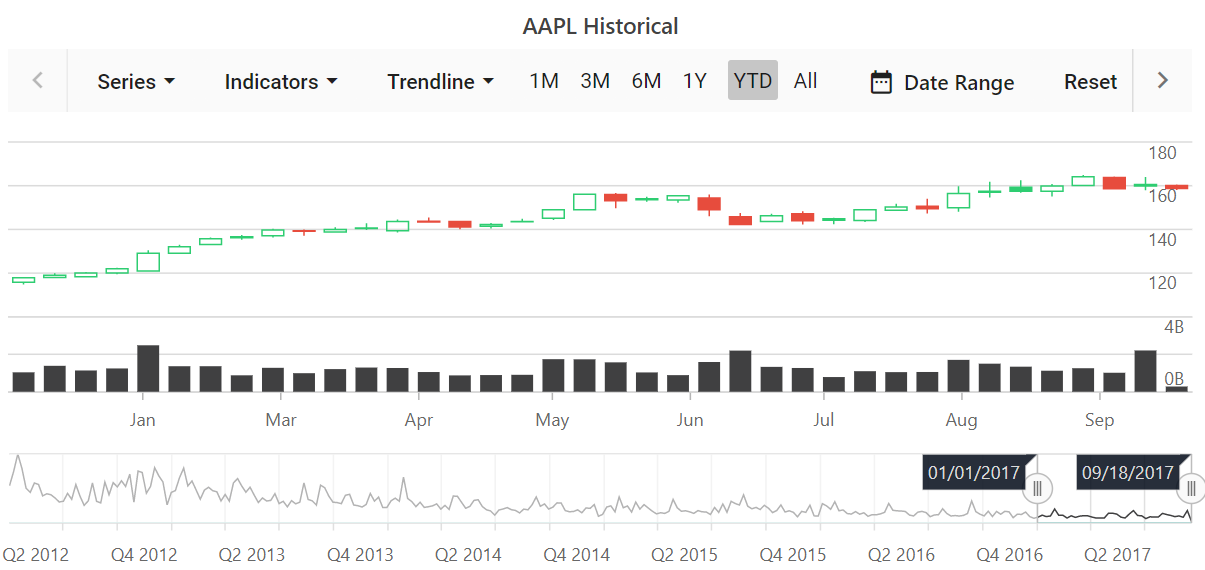
The [React Stock Chart Component](https://www.syncfusion.com/react-components/react-stock-chart) is a well-crafted, easy-to-use financial charting package to track and visualize stock price of any company over a specific period using charting and range tools.
Getting started .
Online demos .
Learn more
#### Key features
* [Data binding](https://ej2.syncfusion.com/react/documentation/stock-chart/working-with-data/): Bind the stock chart component with an array of JSON objects or DataManager. Other than chart series, data label and tooltip can also bound to your data.
* [Range selector](https://ej2.syncfusion.com/react/demos/?utm_source=npm&utm_campaign=stockchart#/material/stock-chart/disabled-period): Supports range selector to filter a date range for data that needs to be visualized.
* [Period selector](https://ej2.syncfusion.com/react/demos/?utm_source=npm&utm_campaign=stockchart#/material/stock-chart/disabled-navigator): Supports period selector to select predefined periods just by a single click.
* [Technical indicators](https://ej2.syncfusion.com/react/demos/?utm_source=npm&utm_campaign=stockchart#/material/stock-chart/default): Incidators allows to analyze the past and predict the future market trends based on historic price, volume, or open interest.
* [Trendlines](https://ej2.syncfusion.com/react/demos/?utm_source=npm&utm_campaign=stockchart#/material/stock-chart/default): Predicts the future trends with predetermined data for any measurements.
* [Stock events](https://ej2.syncfusion.com/react/demos/?utm_source=npm&utm_campaign=stockchart#/material/stock-chart/stock-events): Supports stock events to show different kinds of market events on the chart.
* [Export](https://ej2.syncfusion.com/react/demos/?utm_source=npm&utm_campaign=stockchart#/material/stock-chart/multi-pane): Provides the options to Export the stock chart to PDF, SVG and CSV formats.
* [Appearance](https://ej2.syncfusion.com/react/documentation/stock-chart/appearance/): Colors for the stock chart are picked by the built-in theme, but each element of the stock chart can be customized by simple configuration options.
* [Tooltip](https://ej2.syncfusion.com/react/demos/?utm_source=npm&utm_campaign=stockchart#/material/stock-chart/multi-pane): Provides great user experiance by including a set of interactive features such as tooltip, events, and trackball.
### React Range Navigator
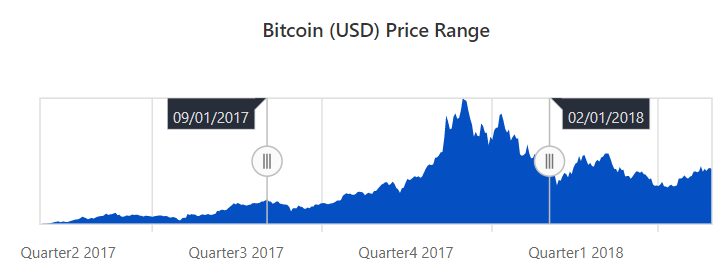
The [React Chart Component](https://www.syncfusion.com/react-components/react-range-selector) is an interface for selecting a small range from a large collection. It is commonly used in financial dashboards to filter a date range for data that needs to be visualized.
Getting started .
Online demos .
Learn more
#### Key features
* [Data sources](https://ej2.syncfusion.com/angular/demos/?utm_source=npm&utm_campaign=range-navigator#/material/range-navigator/stock-chart): Bind the range navigator component with an array of JSON objects or DataManager.
* [Tooltip](https://ej2.syncfusion.com/react/demos/?utm_source=npm&utm_campaign=chart#/material/range-navigator/default): Provides great user experiance by including a set of interactive features such as tooltip, events, and animation.
* [Lightweight](https://ej2.syncfusion.com/react/demos/?utm_source=npm&utm_campaign=chart#/material/range-navigator/light-weight): Supports light-weight range navigator to load in mobile device.
* [Period-selector](https://ej2.syncfusion.com/react/demos/?utm_source=npm&utm_campaign=chart#/material/range-navigator/period-selector): Provides options to select the data over the custom period.
* [Axis types](https://ej2.syncfusion.com/react/demos/?utm_source=npm&utm_campaign=chart#/material/range-navigator/date-time): Supports multiple axis and able to plot different data such as numbers, datetime, logarithmic and string.
### React Sparkline
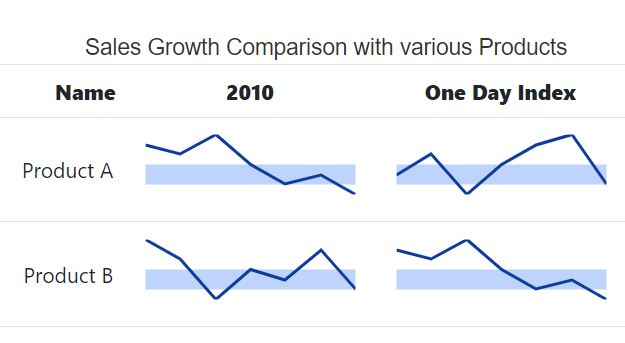
The [React Sparkline Component](https://www.syncfusion.com/react-components/react-sparkline) is a very small chart control drawn without axes or coordinates. The sparklines are easy to interpret and convey more information to users by visualizing data in a small amount of space.
Getting started .
Online demos .
Learn more
#### Key features
* [Series types](https://ej2.syncfusion.com/react/demos/?utm_source=npm&utm_campaign=sparkline#/material/sparkline/series-types): Supports five types of sparklines : line, area, column, win loss, and pie to show data trends.
* [Axis types](https://ej2.syncfusion.com/react/demos/?utm_source=npm&utm_campaign=sparkline#/material/sparkline/axis-types): Supports multiple axis and able to plot different data such as numbers, datetime, logarithmic and string.
* [Data label](https://ej2.syncfusion.com/react/demos/?utm_source=npm&utm_campaign=sparkline#/material/sparkline/customization): Supports data label to annotate points with label to improve the readability of data.
* [Range band](https://ej2.syncfusion.com/react/demos/?utm_source=npm&utm_campaign=sparkline#/material/sparkline/range-band): Provides options to highlight specific range of values.
* [Tooltip](https://ej2.syncfusion.com/react/demos/?utm_source=npm&utm_campaign=sparkline#/material/sparkline/default): Provides great user experiance by including a set of interactive features such as tooltip, events, and trackball.
### React Bullet Chart
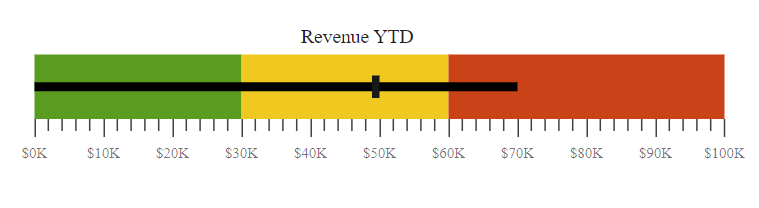
The [React Bullet Chart Component](https://www.syncfusion.com/react-components/react-bullet-chart) is an interface to visually compare measures, similar to the commonly used bar chart. A bullet chart displays one or more measures and compares them with a target value.
Getting started .
Online demos .
Learn more
#### Key features
* [Multiple measures](https://ej2.syncfusion.com/react/demos/?utm_source=npm&utm_campaign=bulletchart#/material/bullet-chart/multiple-data): Provides options to render multiple measure bars as well as multiple target bars to allow comparison of several measures at once.
* [Legend](https://ej2.syncfusion.com/react/demos/?utm_source=npm&utm_campaign=bulletchart#/material/bullet-chart/bullet-legend): Provides options to display additional information about the target and actual bar.
* [RTL support](https://ej2.syncfusion.com/react/demos/?utm_source=npm&utm_campaign=bulletchart#/material/bullet-chart/right-to-left): Provides a full-fledged right-to-left mode which aligns axis, tooltip, legend and data in the chart component from right to left.
* [Tooltip](https://ej2.syncfusion.com/react/demos/?utm_source=npm&utm_campaign=bulletchart#/material/bullet-chart/tooltip): Provides options to display additional information about target and actual on mouse hover.
### React Smith Chart
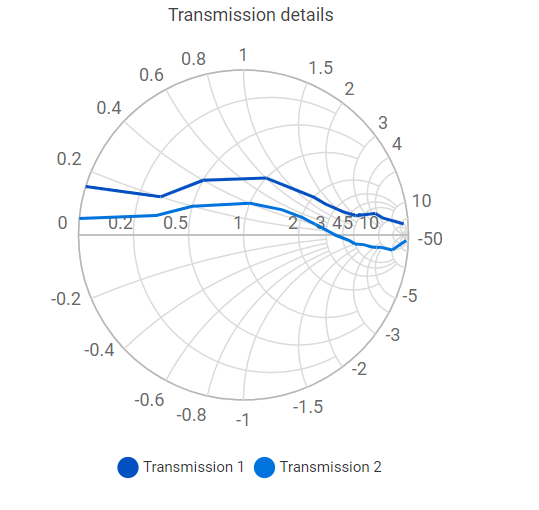
The [React Smith Chart Component](https://www.syncfusion.com/react-components/react-smith-chart) visualize data of high frequency circuit applications. It contains two sets of circles to plot parameters of transmission lines.
Getting started .
Online demos .
Learn more
#### Key features
* [Legend](https://ej2.syncfusion.com/react/demos/?utm_source=npm&utm_campaign=smithchart#/material/smith-chart/default): Provides options to display additional information about the series.
* [Data label](https://ej2.syncfusion.com/react/demos/?utm_source=npm&utm_campaign=smithchart#/material/smith-chart/custom): Supports data label to annotate points with label to improve the readability of data.
* [Tooltip](https://ej2.syncfusion.com/react/demos/?utm_source=npm&utm_campaign=smithchart#/material/smith-chart/custom): Provides options to display additional information about data points on mouse hover.
* [Print and Export](https://ej2.syncfusion.com/react/demos/?utm_source=npm&utm_campaign=smithchart#/material/smith-chart/print-export): Provides support to print and export the rendered smith chart for future use.
## Setup
### Create a React Application
You can use [`create-react-app`](https://github.com/facebookincubator/create-react-app) to setup applications. To create React app use the following command.
```bash
npx create-react-app my-app --template typescript
cd my-app
npm start
```
### Adding Syncfusion Chart package
All Syncfusion react packages are published in the [npmjs.com](https://www.npmjs.com/~syncfusionorg) registry. To install the react chart package, use the following command.
```bash
npm install @syncfusion/ej2-react-charts --save
```
### Add Chart Component
In the **src/App.tsx** file, use the following code snippet to render the Syncfusion React Chart component and import **App.css** to apply styles to the chart:
```typescript
import { ChartComponent, Category, Category, LineSeries } from '@syncfusion/ej2-react-charts';
import * as React from 'react';
import './App.css';
function App() {
let data = [
{ month: 'Jan', sales: 35 }, { month: 'Feb', sales: 28 },
{ month: 'Mar', sales: 34 }, { month: 'Apr', sales: 32 },
{ month: 'May', sales: 40 }, { month: 'Jun', sales: 32 },
{ month: 'Jul', sales: 35 }, { month: 'Aug', sales: 55 },
{ month: 'Sep', sales: 38 }, { month: 'Oct', sales: 30 },
{ month: 'Nov', sales: 25 }, { month: 'Dec', sales: 32 }
];
const primaryxAxis = { valueType: 'Category' };
return
;
};
export default App;
```
## Supported frameworks
Chart components are offered in following list of frameworks.
| [ ](https://www.syncfusion.com/javascript-ui-controls?utm_medium=listing&utm_source=github)
[JavaScript](https://www.syncfusion.com/javascript-ui-controls?utm_medium=listing&utm_source=github) | [ ](https://www.syncfusion.com/angular-components/?utm_medium=listing&utm_source=github)
[Angular](https://www.syncfusion.com/angular-components/?utm_medium=listing&utm_source=github) | [ ](https://www.syncfusion.com/vue-ui-components?utm_medium=listing&utm_source=github)
[Vue](https://www.syncfusion.com/vue-ui-components?utm_medium=listing&utm_source=github) | [ ](https://www.syncfusion.com/aspnet-core-ui-controls?utm_medium=listing&utm_source=github)
[ASP.NET Core](https://www.syncfusion.com/aspnet-core-ui-controls?utm_medium=listing&utm_source=github) | [ ](https://www.syncfusion.com/aspnet-mvc-ui-controls?utm_medium=listing&utm_source=github)
[ASP.NET MVC](https://www.syncfusion.com/aspnet-mvc-ui-controls?utm_medium=listing&utm_source=github) |
| :-----: | :-----: | :-----: | :-----: | :-----: |
## Showcase samples
* Loan Calculator - [Source](https://github.com/syncfusion/ej2-showcase-react-loan-calculator), [Live Demo](https://ej2.syncfusion.com/showcase/react/loancalculator/?utm_source=npm&utm_medium=listing&utm_campaign=react-charts-npm#/default)
## Resources
* [Documentation](https://ej2.syncfusion.com/react/documentation/chart/getting-started)
* [AI Coding Assistant](https://ej2.syncfusion.com/react/documentation/ai-coding-assistants/overview)
* [Theme Studio](https://ej2.syncfusion.com/themestudio/)
* [What's New](https://www.syncfusion.com/products/whatsnew/react?utm_medium=listing&utm_source=github)
* [Road Map](https://www.syncfusion.com/products/roadmap/react)
* [E-Books](https://www.syncfusion.com/succinctly-free-ebooks?searchkey=react&type=all)
## Support
Product support is available through following mediums.
* [Support ticket](https://support.syncfusion.com/support/tickets/create) - Guaranteed Response in 24 hours | Unlimited tickets | Holiday support
* [Community forum](https://www.syncfusion.com/forums/react-js2?utm_source=npm&utm_medium=listing&utm_campaign=react-charts-npm)
* [GitHub issues](https://github.com/syncfusion/ej2-react-ui-components/issues/new)
* [Request feature or report bug](https://www.syncfusion.com/feedback/react?utm_source=npm&utm_medium=listing&utm_campaign=react-charts-npm)
* Live chat
## Changelog
Check the changelog [here](https://github.com/syncfusion/ej2-react-ui-components/blob/master/components/charts/CHANGELOG.md). Get minor improvements and bug fixes every week to stay up to date with frequent updates.
## License and copyright
> This is a commercial product and requires a paid license for possession or use. Syncfusion® licensed software, including this component, is subject to the terms and conditions of Syncfusion's [EULA](https://www.syncfusion.com/eula/es/). To acquire a license for 140+ [React UI components](https://www.syncfusion.com/react-components), you can [purchase](https://www.syncfusion.com/sales/products) or [start a free 30-day trial](https://www.syncfusion.com/account/manage-trials/start-trials).
> A free community [license](https://www.syncfusion.com/products/communitylicense) is also available for companies and individuals whose organizations have less than $1 million USD in annual gross revenue and five or fewer developers.
See [LICENSE FILE](https://github.com/syncfusion/ej2-react-ui-components/blob/master/license) for more info.
© Copyright 2026 Syncfusion® Inc. All Rights Reserved. The Syncfusion® Essential Studio® license and copyright applies to this distribution.
---
_Source: https://npm.io/package/@syncfusion/ej2-react-charts · Machine-readable twin of the npm.io package page. Health data is recomputed on every publish._