# asciichart
> Nice-looking lightweight console ASCII line charts ╭┈╯ with no dependencies
Latest version **1.5.25** (published 2020-08-17) · MIT license · 0 weekly downloads
## Install
```sh
npm install asciichart
pnpm add asciichart
yarn add asciichart
bun add asciichart
```
## Health
**Score 33/100 (F)** — status: abandoned.
Positive: has types package; no vulnerabilities; high quality score.
Warnings: low downloads; no esm support.
Negative: abandoned.
## Facts
| | |
|---|---|
| Version | 1.5.25 |
| Published | 2020-08-17 |
| First published | 2017-02-10 |
| Weekly downloads | 0 |
| License | MIT |
| TypeScript types | separate (@types/asciichart) |
| Module format | CommonJS |
| Dependencies | 0 |
| Unpacked size | 38.9 KB |
| Known vulnerabilities | 0 |
| Install scripts | no |
| GitHub stars | 2109 |
| Author | Igor Kroitor |
| Maintainers | x84, xpl |
| Keywords | asciichart, ascii, chart, charting, charts, console, terminal, draw, box-drawing, box drawing, drawing, stats, line, linear, plot, graph, ascii graphics, graphics, command line, commandline, bash, shell, sh, light |
## Links
- npm: https://www.npmjs.com/package/asciichart
- Repository: https://github.com/kroitor/asciichart
- Issues: https://github.com/kroitor/asciichart/issues
- npm.io page: https://npm.io/package/asciichart
## Alternatives
- [d3-force-3d](https://npm.io/package/d3-force-3d.md) — 1.0M weekly downloads
- [ng2-charts](https://npm.io/package/ng2-charts.md) — 486.8K weekly downloads
- [@arcgis/core](https://npm.io/package/@arcgis/core.md) — 257.8K weekly downloads
- [react-sparklines](https://npm.io/package/react-sparklines.md) — 249.3K weekly downloads
- [react-native-gifted-charts](https://npm.io/package/react-native-gifted-charts.md) — 182.3K weekly downloads
## Recent versions
- 1.5.25 (latest) — 2020-08-17
- 1.5.24 — 2020-07-21
- 1.5.23 — 2020-07-19
- 1.5.21 — 2020-06-05
- 1.5.20 — 2020-05-30
- 1.5.19 — 2020-05-13
- 1.5.18 — 2020-05-13
- 1.5.17 — 2020-04-24
- 1.5.16 — 2020-04-23
- 1.5.15 — 2020-03-29
- 1.5.14 — 2020-03-28
- 1.5.13 — 2020-03-26
- 1.5.12 — 2020-03-26
- 1.5.11 — 2020-03-20
- 1.5.10 — 2020-03-19
- … 32 more at https://npm.io/package/asciichart/versions
## README
# asciichart
[](https://npmjs.com/package/asciichart) [](https://pypi.python.org/pypi/asciichartpy) [](https://travis-ci.org/kroitor/asciichart) [](https://coveralls.io/github/kroitor/asciichart?branch=master) [](https://github.com/kroitor/asciichart/blob/master/LICENSE.txt)
Console ASCII line charts in pure Javascript (for NodeJS and browsers) with no dependencies. This code is absolutely free for any usage, you just do whatever the fuck you want.
 ## Usage
### NodeJS
```sh
npm install asciichart
```
```javascript
var asciichart = require ('asciichart')
var s0 = new Array (120)
for (var i = 0; i < s0.length; i++)
s0[i] = 15 * Math.sin (i * ((Math.PI * 4) / s0.length))
console.log (asciichart.plot (s0))
```
### Browsers
```html
asciichart
```
### Options
The width of the chart will always equal the length of data series. The height and range are determined automatically.
```javascript
var s0 = new Array (120)
for (var i = 0; i < s0.length; i++)
s0[i] = 15 * Math.sin (i * ((Math.PI * 4) / s0.length))
console.log (asciichart.plot (s0))
```
## Usage
### NodeJS
```sh
npm install asciichart
```
```javascript
var asciichart = require ('asciichart')
var s0 = new Array (120)
for (var i = 0; i < s0.length; i++)
s0[i] = 15 * Math.sin (i * ((Math.PI * 4) / s0.length))
console.log (asciichart.plot (s0))
```
### Browsers
```html
asciichart
```
### Options
The width of the chart will always equal the length of data series. The height and range are determined automatically.
```javascript
var s0 = new Array (120)
for (var i = 0; i < s0.length; i++)
s0[i] = 15 * Math.sin (i * ((Math.PI * 4) / s0.length))
console.log (asciichart.plot (s0))
```
 The output can be configured by passing a second parameter to the `plot (series, config)` function. The following options are supported:
```javascript
var config = {
offset: 3, // axis offset from the left (min 2)
padding: ' ', // padding string for label formatting (can be overrided)
height: 10, // any height you want
// the label format function applies default padding
format: function (x, i) { return (padding + x.toFixed (2)).slice (-padding.length) }
}
```
### Scale To Desired Height
The output can be configured by passing a second parameter to the `plot (series, config)` function. The following options are supported:
```javascript
var config = {
offset: 3, // axis offset from the left (min 2)
padding: ' ', // padding string for label formatting (can be overrided)
height: 10, // any height you want
// the label format function applies default padding
format: function (x, i) { return (padding + x.toFixed (2)).slice (-padding.length) }
}
```
### Scale To Desired Height
 ```javascript
var s = []
for (var i = 0; i < 120; i++)
s[i] = 15 * Math.cos (i * ((Math.PI * 8) / 120)) // values range from -15 to +15
console.log (asciichart.plot (s, { height: 6 })) // this rescales the graph to ±3 lines
```
```javascript
var s = []
for (var i = 0; i < 120; i++)
s[i] = 15 * Math.cos (i * ((Math.PI * 8) / 120)) // values range from -15 to +15
console.log (asciichart.plot (s, { height: 6 })) // this rescales the graph to ±3 lines
```
 ### Auto-range
```javascript
var s2 = new Array (120)
s2[0] = Math.round (Math.random () * 15)
for (i = 1; i < s2.length; i++)
s2[i] = s2[i - 1] + Math.round (Math.random () * (Math.random () > 0.5 ? 2 : -2))
console.log (asciichart.plot (s2))
```
### Auto-range
```javascript
var s2 = new Array (120)
s2[0] = Math.round (Math.random () * 15)
for (i = 1; i < s2.length; i++)
s2[i] = s2[i - 1] + Math.round (Math.random () * (Math.random () > 0.5 ? 2 : -2))
console.log (asciichart.plot (s2))
```
 ### Multiple Series
```javascript
var s2 = new Array (120)
s2[0] = Math.round (Math.random () * 15)
for (i = 1; i < s2.length; i++)
s2[i] = s2[i - 1] + Math.round (Math.random () * (Math.random () > 0.5 ? 2 : -2))
var s3 = new Array (120)
s3[0] = Math.round (Math.random () * 15)
for (i = 1; i < s3.length; i++)
s3[i] = s3[i - 1] + Math.round (Math.random () * (Math.random () > 0.5 ? 2 : -2))
console.log (asciichart.plot ([ s2, s3 ]))
```
### Multiple Series
```javascript
var s2 = new Array (120)
s2[0] = Math.round (Math.random () * 15)
for (i = 1; i < s2.length; i++)
s2[i] = s2[i - 1] + Math.round (Math.random () * (Math.random () > 0.5 ? 2 : -2))
var s3 = new Array (120)
s3[0] = Math.round (Math.random () * 15)
for (i = 1; i < s3.length; i++)
s3[i] = s3[i - 1] + Math.round (Math.random () * (Math.random () > 0.5 ? 2 : -2))
console.log (asciichart.plot ([ s2, s3 ]))
```
 ### Colors
```javascript
var arr1 = new Array (120)
arr1[0] = Math.round (Math.random () * 15)
for (i = 1; i < arr1.length; i++)
arr1[i] = arr1[i - 1] + Math.round (Math.random () * (Math.random () > 0.5 ? 2 : -2))
var arr2 = new Array (120)
arr2[0] = Math.round (Math.random () * 15)
for (i = 1; i < arr2.length; i++)
arr2[i] = arr2[i - 1] + Math.round (Math.random () * (Math.random () > 0.5 ? 2 : -2))
var arr3 = new Array (120)
arr3[0] = Math.round (Math.random () * 15)
for (i = 1; i < arr3.length; i++)
arr3[i] = arr3[i - 1] + Math.round (Math.random () * (Math.random () > 0.5 ? 2 : -2))
var arr4 = new Array (120)
arr4[0] = Math.round (Math.random () * 15)
for (i = 1; i < arr4.length; i++)
arr4[i] = arr4[i - 1] + Math.round (Math.random () * (Math.random () > 0.5 ? 2 : -2))
var config = {
colors: [
asciichart.blue,
asciichart.green,
asciichart.default, // default color
undefined, // equivalent to default
]
}
console.log (asciichart.plot([ arr1, arr2, arr3, arr4 ], config))
```
### Colors
```javascript
var arr1 = new Array (120)
arr1[0] = Math.round (Math.random () * 15)
for (i = 1; i < arr1.length; i++)
arr1[i] = arr1[i - 1] + Math.round (Math.random () * (Math.random () > 0.5 ? 2 : -2))
var arr2 = new Array (120)
arr2[0] = Math.round (Math.random () * 15)
for (i = 1; i < arr2.length; i++)
arr2[i] = arr2[i - 1] + Math.round (Math.random () * (Math.random () > 0.5 ? 2 : -2))
var arr3 = new Array (120)
arr3[0] = Math.round (Math.random () * 15)
for (i = 1; i < arr3.length; i++)
arr3[i] = arr3[i - 1] + Math.round (Math.random () * (Math.random () > 0.5 ? 2 : -2))
var arr4 = new Array (120)
arr4[0] = Math.round (Math.random () * 15)
for (i = 1; i < arr4.length; i++)
arr4[i] = arr4[i - 1] + Math.round (Math.random () * (Math.random () > 0.5 ? 2 : -2))
var config = {
colors: [
asciichart.blue,
asciichart.green,
asciichart.default, // default color
undefined, // equivalent to default
]
}
console.log (asciichart.plot([ arr1, arr2, arr3, arr4 ], config))
```
 ### See Also
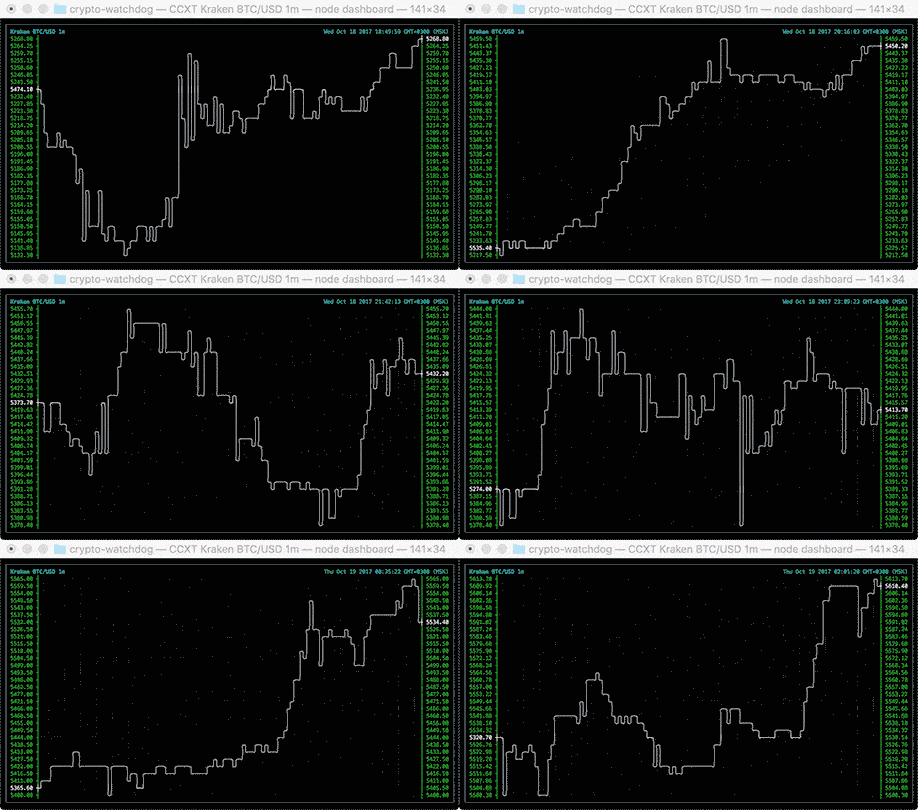
A util by [madnight](https://github.com/madnight) for drawing Bitcoin/Ether/altcoin charts in command-line console: [bitcoin-chart-cli](https://github.com/madnight/bitcoin-chart-cli).

### Ports
Special thx to all who helped port it to other languages, great stuff!
- [Python port](https://pypi.org/project/asciichartpy) included!
- Java: [ASCIIGraph](https://github.com/MitchTalmadge/ASCIIGraph), ported by [MitchTalmadge](https://github.com/MitchTalmadge). If you're a Java-person, check it out!
- Go: [asciigraph](https://github.com/guptarohit/asciigraph), ported by [guptarohit](https://github.com/guptarohit), Go people! )
- Haskell: [asciichart](https://github.com/madnight/asciichart), ported by [madnight](https://github.com/madnight) to Haskell world!
- Ruby: [ascii_chart](https://github.com/zhustec/ascii_chart), ported by [zhustec](https://github.com/zhustec)!
- Elixir: [asciichart](https://github.com/sndnv/asciichart), ported by [sndv](https://github.com/sndnv)!
- Perl: [App::AsciiChart](https://github.com/vti/app-asciichart), ported by [vti](https://github.com/vti)!
- C: [plot](https://github.com/annacrombie/plot), ported by [annacrombie](https://github.com/annacrombie) with a ruby extension!
- R: [asciichartr](https://github.com/blmayer/asciichartr), ported by [blmayer](https://github.com/blmayer)!
- Rust: [rasciigraph](https://github.com/orhanbalci/rasciigraph), ported by [orhanbalci](https://github.com/orhanbalci)!
- PHP: [PHP-colored-ascii-linechart](https://github.com/noximo/PHP-colored-ascii-linechart), ported by [noximo](https://github.com/noximo)!
- C#: [asciichart-sharp](https://github.com/samcarton/asciichart-sharp), ported by [samcarton](https://github.com/samcarton)!
### Future work (coming soon, hopefully)
- levels and points on the graph!
- even better value formatting and auto-scaling!
---
_Source: https://npm.io/package/asciichart · Machine-readable twin of the npm.io package page. Health data is recomputed on every publish._
### See Also
A util by [madnight](https://github.com/madnight) for drawing Bitcoin/Ether/altcoin charts in command-line console: [bitcoin-chart-cli](https://github.com/madnight/bitcoin-chart-cli).

### Ports
Special thx to all who helped port it to other languages, great stuff!
- [Python port](https://pypi.org/project/asciichartpy) included!
- Java: [ASCIIGraph](https://github.com/MitchTalmadge/ASCIIGraph), ported by [MitchTalmadge](https://github.com/MitchTalmadge). If you're a Java-person, check it out!
- Go: [asciigraph](https://github.com/guptarohit/asciigraph), ported by [guptarohit](https://github.com/guptarohit), Go people! )
- Haskell: [asciichart](https://github.com/madnight/asciichart), ported by [madnight](https://github.com/madnight) to Haskell world!
- Ruby: [ascii_chart](https://github.com/zhustec/ascii_chart), ported by [zhustec](https://github.com/zhustec)!
- Elixir: [asciichart](https://github.com/sndnv/asciichart), ported by [sndv](https://github.com/sndnv)!
- Perl: [App::AsciiChart](https://github.com/vti/app-asciichart), ported by [vti](https://github.com/vti)!
- C: [plot](https://github.com/annacrombie/plot), ported by [annacrombie](https://github.com/annacrombie) with a ruby extension!
- R: [asciichartr](https://github.com/blmayer/asciichartr), ported by [blmayer](https://github.com/blmayer)!
- Rust: [rasciigraph](https://github.com/orhanbalci/rasciigraph), ported by [orhanbalci](https://github.com/orhanbalci)!
- PHP: [PHP-colored-ascii-linechart](https://github.com/noximo/PHP-colored-ascii-linechart), ported by [noximo](https://github.com/noximo)!
- C#: [asciichart-sharp](https://github.com/samcarton/asciichart-sharp), ported by [samcarton](https://github.com/samcarton)!
### Future work (coming soon, hopefully)
- levels and points on the graph!
- even better value formatting and auto-scaling!

---
_Source: https://npm.io/package/asciichart · Machine-readable twin of the npm.io package page. Health data is recomputed on every publish._