# bar-charts-react
> This is a flexible bar charts
Latest version **1.0.5** (published 2019-12-06) · ISC license · 0 weekly downloads
## Install
```sh
npm install bar-charts-react
pnpm add bar-charts-react
yarn add bar-charts-react
bun add bar-charts-react
```
## Health
**Score 15/100 (F)** — status: abandoned.
Positive: no vulnerabilities.
Warnings: low downloads; no types; no esm support.
Negative: abandoned; low maintenance score.
## Facts
| | |
|---|---|
| Version | 1.0.5 |
| Published | 2019-12-06 |
| First published | 2019-10-26 |
| Weekly downloads | 0 |
| License | ISC |
| TypeScript types | none |
| Module format | CommonJS |
| Dependencies | 2 |
| Unpacked size | 40.2 KB |
| Known vulnerabilities | 0 |
| Install scripts | no |
| GitHub stars | 0 |
| Author | lle_wang |
| Maintainers | lle_wang |
| Keywords | bar chatrs, self-adaption, self-adaption bar chatrs, flexible bar chatrs, bar graph, react, mobile, canvas, npm |
## Links
- npm: https://www.npmjs.com/package/bar-charts-react
- Repository: https://github.com/Eye12/bar-charts
- Issues: https://github.com/Eye12/bar-charts/issues
- npm.io page: https://npm.io/package/bar-charts-react
## Dependencies (2)
- [react](https://npm.io/package/react.md) ^16.9.0
- [react-dom](https://npm.io/package/react-dom.md) ^16.9.0
## Alternatives
- [mobx-react](https://npm.io/package/mobx-react.md) — 2.8M weekly downloads
- [rc-tree](https://npm.io/package/rc-tree.md) — 2.6M weekly downloads
- [@react-oauth/google](https://npm.io/package/@react-oauth/google.md) — 1.3M weekly downloads
- [@wagmi/connectors](https://npm.io/package/@wagmi/connectors.md) — 877.0K weekly downloads
- [vee-validate](https://npm.io/package/vee-validate.md) — 836.4K weekly downloads
## Recent versions
- 1.0.5 (latest) — 2019-12-06
- 1.0.4 — 2019-12-06
- 1.0.3 — 2019-10-27
- 1.0.2 — 2019-10-26
- 1.0.1 — 2019-10-26
## README
# bar-charts
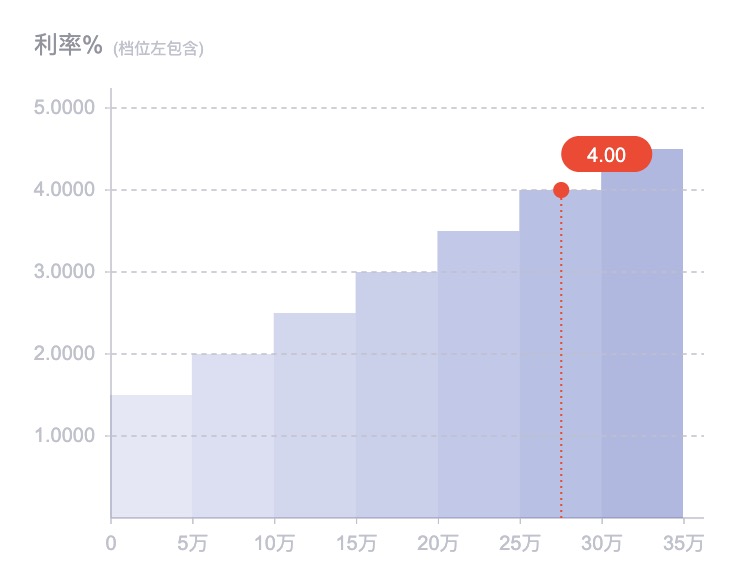
This is a flexible and self-adaption bar charts.
you can choose some properties as you like to make the bar charts as you want.
 ## Installation
npm install bar-charts-react --dev
/
yarn add bar-charts-react --dev
## Example
import React, {Component} from "react";
import ReactDOM from "react-dom";
import BarCharts from "bar-charts-react";
class Demo extends Component {
render() {
return (
);
}
}
ReactDOM.render(, document.getElementById("root"));
## Properties
| 属性 | 说明 | 类型 | 默认值 | 可选值 |
|:-------------|:-------------|:-------------|:-------------|:-------------|
| width | 画布宽 | number | 设备屏幕可视宽度值 |
| height | 画布高 | number | 300 |
| xAxisDatas | X轴相关数据 | array | BASE_X_AXIS(见./utils/globalConst.js) |
| yAxisDatas | Y轴相关数据 | array | BASE_Y_AXIS(见./utils/globalConst.js) |
| rePainting | 重新绘制 | function | 见demo中如何使用的 |
| markIndex | 显示指定柱子标记索引值 | number | "none" |
| font | 基础文字大小以及字体样式 | string | 20px Arial |
| textMargin | 文字距离刻度线边距 | number | 10 |
| leftTopTitle | 左上角标题内容 | string | 利率% |
| ltopTitleColor | 左上角标题颜色 | string | #91939E |
| ltopTitleFont | 左上角标题文字大小及字体样式 | string | 24px Arial |
| ltopTitleTips | 左上角标题后提示小文本内容 | string | (档位左包含) |
| ltopTitleTipsFont | 左上角标题后提示文字大小及字体样式 | string | 16px Arial |
| ltopTitleTipsColor | 左上角标题后提示文字颜色 | string | #BFC1CC |
| ltopTitleMargin | 左上角标题距离Y轴边距 | number | 30 |
| scaleLength | 刻度线长度 | number | 6 |
| scaleDirectionY | Y轴刻度线防线 | string | "left" |
| scaleBoundaryGap | 最后一根刻度线距离轴线尾部边界值 | number | 20 |
| scaleTextFont | 刻度线对应文字大小及字体样式 | string | 20px Arial |
| scaleTextColor | 刻度线对应文字颜色 | string | #BFC1CC |
| yAxisTextAlign | Y轴刻度线文字左对齐还是右对齐 | string | left |
| firstScaleX | X轴0点刻度线是否需要 | boolean | true |
| firstScaleY | Y轴0点刻度线是否需要 | boolean | false |
| axisColor | 轴线颜色 | string | #BFC1CC |
| gridDashX | 平行于X轴的网格线使用虚线样式 | array | undefined |
| gridColorX | 平行于X轴的网格线颜色 | string | #BFC1CC |
| xAxisScaleAlign | X轴的刻度线关于柱子对齐方式 | string | side | side / center
| xAxisTxtAlign | X轴文字关于刻度线对齐方式 | string | center | center / between
| barPadding | 柱子内边距 | number | 0 |
| barBgColor | 柱子背景色 | array | BAR_BG_COLOR(见./utils/globalConst.js) |
| markLineColor | 标记线颜色 | string | #ff3822 |
| markLineWidth | 标记线宽度 | number | 2 |
| markLineDash | 标记线使用虚线样式 | array | undefined |
| circlePointColor | 标记圆点背景色 | string | #ff3822 |
| circlePointRadius | 标记圆点半径 | number | 8 |
| roundRectRadius | 标记圆角矩形半径 | number | 18 |
| roundRectPadding | 标记圆角矩形内边距 | string | 8, 26 |
| roundRectMargin | 标记圆角矩形距离标记圆点距离 | number | 10 |
| roundRectBgColor | 标记圆角矩形背景颜色 | string | #ff3822 |
| markFont | 标记文本字体大小及字体样式 | string | 20px Arial |
| markTextColor | 标记文本字体颜色 | string | #fff |
## Question
If you encounter any problems during use the bar-charts,
you can go to the bar-charts-react library in github and leave your issue for me.
I'll deal with the issue as soon as I see it
## License
MIT
## Keywords
react chart react-component bar mobile
canvas bar-charts self-adaption flexible bar chatrs bar graph
---
_Source: https://npm.io/package/bar-charts-react · Machine-readable twin of the npm.io package page. Health data is recomputed on every publish._