# chartjs-plugin-stacked100
> This plugin for Chart.js that makes your bar chart to 100% stacked bar chart
Latest version **1.7.1** (published 2026-02-20) · MIT license · 0 weekly downloads
## Install
```sh
npm install chartjs-plugin-stacked100
pnpm add chartjs-plugin-stacked100
yarn add chartjs-plugin-stacked100
bun add chartjs-plugin-stacked100
```
## Health
**Score 60/100 (C)** — status: stable.
Positive: has types; no vulnerabilities; high maintenance score; high quality score.
Warnings: low downloads; no esm support.
## Facts
| | |
|---|---|
| Version | 1.7.1 |
| Published | 2026-02-20 |
| First published | 2017-03-24 |
| Weekly downloads | 0 |
| License | MIT |
| TypeScript types | bundled |
| Module format | CommonJS |
| Dependencies | 0 |
| Unpacked size | 33.8 KB |
| Known vulnerabilities | 0 |
| Install scripts | no |
| GitHub stars | 141 |
| Author | y-takey |
| Maintainers | y-takey |
| Keywords | chart.js |
## Links
- npm: https://www.npmjs.com/package/chartjs-plugin-stacked100
- Repository: https://github.com/y-takey/chartjs-plugin-stacked100
- Homepage: https://github.com/y-takey/chartjs-plugin-stacked100#readme
- Issues: https://github.com/y-takey/chartjs-plugin-stacked100/issues
- npm.io page: https://npm.io/package/chartjs-plugin-stacked100
## Alternatives
- [d3-force-3d](https://npm.io/package/d3-force-3d.md) — 1.0M weekly downloads
- [ng2-charts](https://npm.io/package/ng2-charts.md) — 486.8K weekly downloads
- [@arcgis/core](https://npm.io/package/@arcgis/core.md) — 257.8K weekly downloads
- [react-sparklines](https://npm.io/package/react-sparklines.md) — 249.3K weekly downloads
- [react-native-gifted-charts](https://npm.io/package/react-native-gifted-charts.md) — 182.3K weekly downloads
## Recent versions
- 1.7.1 (latest) — 2026-02-20
- 1.7.0 — 2024-11-13
- 1.6.0 — 2024-11-02
- 1.5.3 — 2024-03-31
- 1.5.2 — 2023-10-11
- 1.5.1 — 2023-09-30
- 1.5.0 — 2023-09-29
- 1.4.0 — 2023-04-24
- 1.3.0 — 2022-12-12
- 1.2.1 — 2022-05-30
- 1.2.0 — 2021-12-22
- 1.1.5 — 2021-12-22
- 1.1.4 — 2021-12-17
- 1.1.3 — 2021-12-13
- 1.1.2 — 2021-12-10
- … 26 more at https://npm.io/package/chartjs-plugin-stacked100/versions
## README
# chartjs-plugin-stacked100
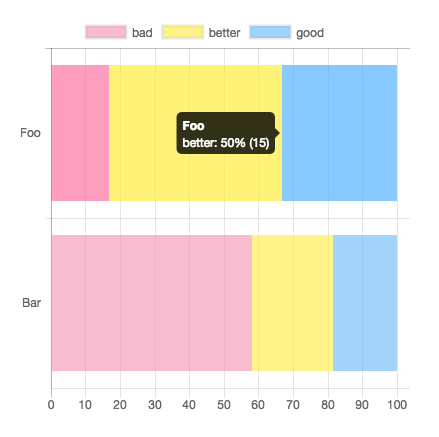
This plugin for Chart.js that makes your bar chart to 100% stacked bar chart.
Requires **Chart.js v3 or higher**.
Demo: https://y-takey.github.io/chartjs-plugin-stacked100
## Installation
### npm
```
yarn add chartjs-plugin-stacked100
```
or
```
npm install chartjs-plugin-stacked100 --save
```
```js
import { Chart } from "chart.js";
import ChartjsPluginStacked100 from "chartjs-plugin-stacked100";
Chart.register(ChartjsPluginStacked100);
```
### CDN
```html
```
```js
Chart.register(ChartjsPluginStacked100.default);
```
## Options
| Name | Type | Default | Description |
| :------------------ | :---------------------------- | :------ | :------------------------------------------------------------------------------------------------------------------------------------------ |
| enable | boolean | false | |
| replaceTooltipLabel | boolean | true | replace tooltip label automatically. |
| fixNegativeScale | boolean | true | when datasets has negative value and `fixNegativeScale` is `false`, the nagative scale is variable. (the range is between `-100` and `-1`) |
| individual | boolean | false | scale the highest bar to 100%, and the rest would be proportional to the highest bar of a stack. |
| round | `"off"` \| `"down"` \| `"up"` | `"off"` | Use `"off"` to `Math.round`, `"down"` to `Math.floor`, and `"up"` to `Math.ceil`. |
| precision | number | 1 | precision of percentage. the range is between `0` and `16` |
| axisId | string | - | This option allows you to stack only the axis in a chart that includes multiple axes. By default, the plugin will attempt to stack all axes |
## Usage
### Basic
specify plugin options with `{ stacked100: { enable: true } }`.
### Use your tooltip label
specify plugin options with `{ stacked100: { enable: true, replaceTooltipLabel: false } }`.
and you can pass tooltip option.
```javascript
new Chart(document.getElementById("my-chart"), {
type: "bar",
data: {},
options: {
tooltips: {
callbacks: {
label: (tooltipItem) => {
const data = tooltipItem.chart.data;
const datasetIndex = tooltipItem.datasetIndex;
const index = tooltipItem.dataIndex;
const datasetLabel = data.datasets[datasetIndex].label || "";
// You can use two type values.
// `data.originalData` is raw values,
// `data.calculatedData` is percentage values, e.g. 20.5 (The total value is 100.0)
const originalValue = data.originalData[datasetIndex][index];
const rateValue = data.calculatedData[datasetIndex][index];
return `${datasetLabel}: ${rateValue}% (raw ${originalValue})`;
},
},
},
plugins: {
stacked100: { enable: true, replaceTooltipLabel: false },
},
},
});
```
### Specify the precision of the percentage value
You can pass `precision` option. (default value is `1` )
For example, when you pass `{ stacked100: { enable: true, precision: 3 } }`, the result is `0.123%` .
#### Examples
```javascript
new Chart(document.getElementById("my-chart"), {
type: "bar",
data: {
labels: ["Foo", "Bar"],
datasets: [
{ label: "bad", data: [5, 25], backgroundColor: "rgba(244, 143, 177, 0.6)" },
{ label: "better", data: [15, 10], backgroundColor: "rgba(255, 235, 59, 0.6)" },
{ label: "good", data: [10, 8], backgroundColor: "rgba(100, 181, 246, 0.6)" },
],
},
options: {
indexAxis: "y",
plugins: {
stacked100: { enable: true },
},
},
});
```
#### Datapoints can be Objects
```javascript
...
// line or bar charts
datasets: [
{ data: [{ y: 5 }, { y: 25 }] },
{ data: [{ y: 15 }, { y: 10 }] },
{ data: [{ y: 10 }, { y: 8 }] }
]
// horizontalBar charts
datasets: [
{ data: [{ x: 5 }, { x: 25 }] },
{ data: [{ x: 15 }, { x: 10 }] },
{ data: [{ x: 10 }, { x: 8 }] }
]
...
```
##### How to use datalabels plugin
```javascript
new Chart(document.getElementById("my-chart"), {
type: "bar",
data: {},
options: {
plugins: {
datalabels: {
formatter: (_value, context) => {
const data = context.chart.data;
const { datasetIndex, dataIndex } = context;
return `${data.calculatedData[datasetIndex][dataIndex]}% (${data.originalData[datasetIndex][dataIndex]})`;
},
},
stacked100: { enable: true },
},
},
});
```
### Use with React
```bash
npx create-react-app demo-react
cd demo-react
npm install react-chartjs-2 chartjs-plugin-stacked100 --save
```
Then use it:
```typescript
import { Chart, Bar } from "react-chartjs-2";
import ChartjsPluginStacked100 from "chartjs-plugin-stacked100";
Chart.register(ChartjsPluginStacked100);
const ChartData = (props: any) => {
return (
<>
{
}
);
};
export default ChartData;
```
You can find a working example in [the demo-react folder](./examples/demo-react/)
## Supported chart types
- bar
- line (via [@HoJSim](https://github.com/HoJSim), thanks!)
## Contributing
Pull requests and issues are always welcome.
For bugs and feature requests, [please create an issue](https://github.com/y-takey/chartjs-plugin-stacked100/issues).
1. Fork it!
2. Create your feature branch: `git checkout -b my-new-feature`
3. Commit your changes: `git commit -am 'Add some feature'`
4. Push to the branch: `git push origin my-new-feature`
5. Submit a pull request!
### Development
- install: `yarn install`
- start dev server: `yarn start`
- unit test: `yarn test:watch` or `yarn test`
- publish the plugin: `npm version (major|minor|patch) && npm publish`
- check: `yarn dev`
- deploy to github pages: `yarn gh`
---
_Source: https://npm.io/package/chartjs-plugin-stacked100 · Machine-readable twin of the npm.io package page. Health data is recomputed on every publish._