# chartjs-plugin-trendline
> Trendline for Chart.js
Latest version **3.3.0** (published 2026-10-29) · MIT license · 0 weekly downloads
## Install
```sh
npm install chartjs-plugin-trendline
pnpm add chartjs-plugin-trendline
yarn add chartjs-plugin-trendline
bun add chartjs-plugin-trendline
```
## Health
**Score 73/100 (B)** — status: active.
Positive: has types package; esm support; no vulnerabilities; has provenance; recently updated; high maintenance score; high quality score.
Warnings: low downloads.
## Facts
| | |
|---|---|
| Version | 3.3.0 |
| Published | 2026-10-29 |
| First published | 2017-11-28 |
| Weekly downloads | 0 |
| License | MIT |
| TypeScript types | separate (@types/chartjs-plugin-trendline) |
| Module format | ESM + CommonJS |
| Dependencies | 0 |
| Unpacked size | 523.8 KB |
| Known vulnerabilities | 0 |
| Install scripts | no |
| Provenance | attested (GitHub Actions) |
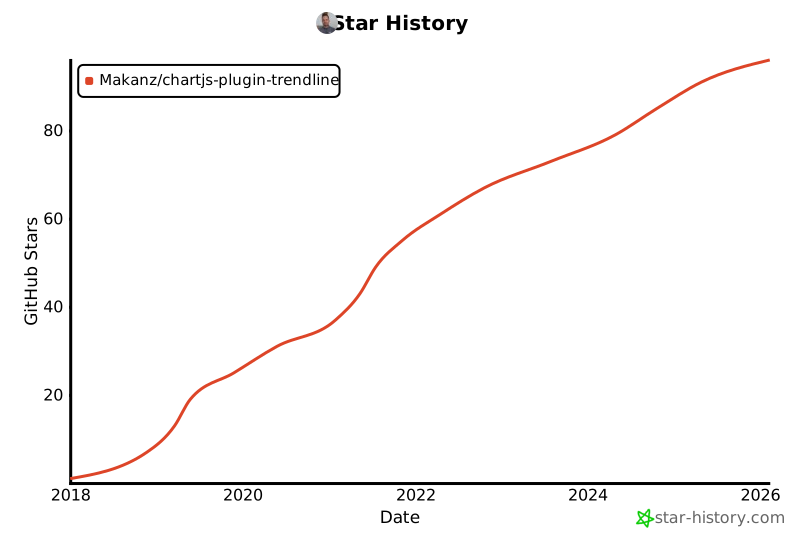
| GitHub stars | 99 |
| Author | Marcus Alsterfjord |
| Maintainers | makanz |
## Links
- npm: https://www.npmjs.com/package/chartjs-plugin-trendline
- Repository: https://github.com/Makanz/chartjs-plugin-trendline
- Homepage: https://github.com/Makanz/chartjs-plugin-trendline#readme
- Issues: https://github.com/Makanz/chartjs-plugin-trendline/issues
- npm.io page: https://npm.io/package/chartjs-plugin-trendline
## Recent versions
- 3.3.0 (latest) — 2026-10-29
- 3.0.0-beta.1 (beta) — 2025-06-07
- 3.2.14 — 2026-10-21
- 3.2.13 — 2026-09-15
- 3.2.12 — 2026-08-13
- 3.2.9 — 2026-07-29
- 3.2.8 — 2026-07-22
- 3.2.4 — 2026-03-01
- 3.2.3 — 2026-02-22
- 3.2.0 — 2025-11-14
- 3.1.1 — 2025-09-03
- 3.1.0 — 2025-09-02
- 3.0.3 — 2025-09-02
- 3.0.2 — 2025-08-28
- 3.0.1 — 2025-07-15
- … 30 more at https://npm.io/package/chartjs-plugin-trendline/versions
## README
# chartjs-plugin-trendline
This plugin draws linear and exponential trendlines in your Chart.
It has been tested with Chart.js version 4.6.1.
## 📊 [View Live Examples](https://makanz.github.io/chartjs-plugin-trendline/)
See the plugin in action with interactive examples for different chart types.
## Installation
> **Note:** Version 3.2.0+ supports ES modules (ESM) for modern bundlers like Vite, SvelteKit, and Next.js. See [MIGRATION.md](./MIGRATION.md) for upgrade details.
### Modern Bundlers (Vite, SvelteKit, Next.js, webpack 5+)
Install via npm:
```bash
npm i chart.js chartjs-plugin-trendline
```
Import and register with Chart.js:
```js
import { Chart } from 'chart.js';
import ChartJSTrendline from 'chartjs-plugin-trendline';
Chart.register(ChartJSTrendline);
```
### Node.js (CommonJS)
```js
const { Chart } = require('chart.js');
const ChartJSTrendline = require('chartjs-plugin-trendline');
Chart.register(ChartJSTrendline);
```
### Browser (CDN)
Load Chart.js first, then the plugin which will automatically register itself:
```html
```
The plugin is now available globally as `ChartJSTrendline` and auto-registers with Chart.js.
## Configuration
To configure the trendline plugin you simply add a new config options to your dataset in your chart config.
### Linear Trendlines
For linear trendlines (straight lines), use the `trendlineLinear` configuration:
```javascript
{
trendlineLinear: {
colorMin: Color,
colorMax: Color,
lineStyle: string, // "dotted" | "solid" | "dashed" | "dashdot"
width: number,
xAxisKey: string, // optional
yAxisKey: string, // optional
projection: boolean, // optional
trendoffset: number, // optional, if > 0 skips first n elements, if < 0 uses last n elements
// optional
label: {
color: Color,
text: string,
display: boolean,
displayValue: boolean, // shows slope value
offset: number,
percentage: boolean,
font: {
family: string,
size: number,
}
},
// optional
legend: {
text: string,
strokeStyle: Color,
fillStyle: Color,
lineCap: string,
lineDash: number[],
lineWidth: number,
}
}
}
```
### Exponential Trendlines
For exponential trendlines (curves of the form y = a × e^(b×x)), use the `trendlineExponential` configuration:
```javascript
{
trendlineExponential: {
colorMin: Color,
colorMax: Color,
lineStyle: string, // "dotted" | "solid" | "dashed" | "dashdot"
width: number,
xAxisKey: string, // optional
yAxisKey: string, // optional
projection: boolean, // optional
trendoffset: number, // optional, if > 0 skips first n elements, if < 0 uses last n elements
// optional
label: {
color: Color,
text: string,
display: boolean,
displayValue: boolean, // shows exponential parameters (a, b)
offset: number,
font: {
family: string,
size: number,
}
},
// optional
legend: {
text: string,
strokeStyle: Color,
fillStyle: Color,
lineCap: string,
lineDash: number[],
lineWidth: number,
}
}
}
```
**Note:** Exponential trendlines work best with positive y-values. The equation fitted is y = a × e^(b×x), where:
- `a` is the coefficient (scaling factor)
- `b` is the growth rate (positive for growth, negative for decay)
## Examples
- [Linear Trendline Example](./example/lineChart.html)
- [Exponential Trendline Example](./example/exponentialChart.html)
- [Bar Chart with Trendline](./example/barChart.html)
- [Scatter Chart with Trendline](./example/scatterChart.html)
## Supported chart types
- bar
- line
- scatter
Both linear and exponential trendlines are supported for all chart types.
## Contributing
Pull requests and issues are always welcome.
For bugs and feature requests, [please create an issue](https://github.com/Makanz/chartjs-plugin-trendline/issues).
## License
chartjs-plugin-trendline.js is available under the [MIT license](http://opensource.org/licenses/MIT).
## Star History
[](https://star-history.com/#Makanz/chartjs-plugin-trendline&Date)
---
_Source: https://npm.io/package/chartjs-plugin-trendline · Machine-readable twin of the npm.io package page. Health data is recomputed on every publish._