# dash_express_components
> Simple widgets to add plotly express style plotting to dash
Latest version **0.0.115** (published 2025-04-01) · MIT license · 0 weekly downloads
## Install
```sh
npm install dash_express_components
pnpm add dash_express_components
yarn add dash_express_components
bun add dash_express_components
```
## Health
**Score 25/100 (F)** — status: maintenance-mode.
Positive: no vulnerabilities.
Warnings: low downloads; no types; no esm support; large bundle; pre 1.0.
Negative: stale; low maintenance score.
## Facts
| | |
|---|---|
| Version | 0.0.115 |
| Published | 2025-04-01 |
| First published | 2021-12-26 |
| Weekly downloads | 0 |
| License | MIT |
| TypeScript types | none |
| Module format | CommonJS |
| Node | >=8.11.0 |
| Dependencies | 11 |
| Unpacked size | 14.7 MB |
| Known vulnerabilities | 0 (+1 in 1 direct dependencies) |
| Install scripts | no |
| Author | Viktor Krückl |
| Maintainers | vikru |
## Links
- npm: https://www.npmjs.com/package/dash_express_components
- npm.io page: https://npm.io/package/dash_express_components
## Dependencies (11)
- [ramda](https://npm.io/package/ramda.md) ^0.27.2
- [exceljs](https://npm.io/package/exceljs.md) ^4.3.0
- [chroma-js](https://npm.io/package/chroma-js.md) ^2.1.2
- [plotly.js](https://npm.io/package/plotly.js.md) ^1.58.4
- [react-select](https://npm.io/package/react-select.md) ^5.2.1
- [plotly.js-dist](https://npm.io/package/plotly.js-dist.md) ^2.8.3
- [react-bootstrap](https://npm.io/package/react-bootstrap.md) ^2.0.4
- [react-list-editable](https://npm.io/package/react-list-editable.md) ^0.1.0
- [@nx-js/compiler-util](https://npm.io/package/@nx-js/compiler-util.md) ^2.0.0
- [react-datetime-picker](https://npm.io/package/react-datetime-picker.md) ^3.4.3
- [react-resize-detector](https://npm.io/package/react-resize-detector.md) ^6.7.7
## Recent versions
- 0.0.115 (latest) — 2025-04-01
- 0.0.114 — 2025-03-11
- 0.0.113 — 2025-02-24
- 0.0.112 — 2025-01-22
- 0.0.111 — 2025-01-11
- 0.0.110 — 2024-11-22
- 0.0.108 — 2024-10-25
- 0.0.107 — 2024-10-25
- 0.0.106 — 2024-10-25
- 0.0.105 — 2024-10-17
- 0.0.104 — 2024-09-16
- 0.0.103 — 2024-09-13
- 0.0.102 — 2024-08-01
- 0.0.101 — 2024-07-09
- 0.0.100 — 2024-06-02
- … 96 more at https://npm.io/package/dash_express_components/versions
## README
# Dash Express Components

[](https://pypi.org/project/dash-express-components)
[](https://www.npmjs.com/package/dash_express_components)
[](https://vk.github.io/dash-express-components)
[](https://github.com/VK/dash-express-components/actions/workflows/test.yml)
[](https://codecov.io/gh/VK/dash-express-components)
### Components to bring [Plotly Express](https://plotly.com/python/plotly-express/) style plots to [Dash](https://dash.plotly.com/):
* [**dxc.Filter**](https://vk.github.io/dash-express-components/Filter.html) to define filter configurations for numerical, categorical or temporal columns.
* [**dxc.Transform**](https://vk.github.io/dash-express-components/Transform.html) to specify a series of data transformations like melt, group by or aggregate.
* [**dxc.Plotter**](https://vk.github.io/dash-express-components/Plotter.html) to set a plot layout like scatter, box, image or table.
* [**dxc.Configurator**](https://vk.github.io/dash-express-components/Configurator.html) is a component that combines
[**dxc.Filter**](https://vk.github.io/dash-express-components/Filter.html),
[**dxc.Transform**](https://vk.github.io/dash-express-components/Transform.html) and
[**dxc.Plotter**](https://vk.github.io/dash-express-components/Plotter.html)
to make the components even easier to use, since the interaction between them is handled automatically.
* [**dxc.Graph**](https://vk.github.io/dash-express-components/Graph.html) uses [dcc.Graph](https://dash.plotly.com/dash-core-components/graph) and [dash_table.DataTable](https://dash.plotly.com/datatable) to show a plot or a table based on the plot configuration.
### A typical data flow looks like this:
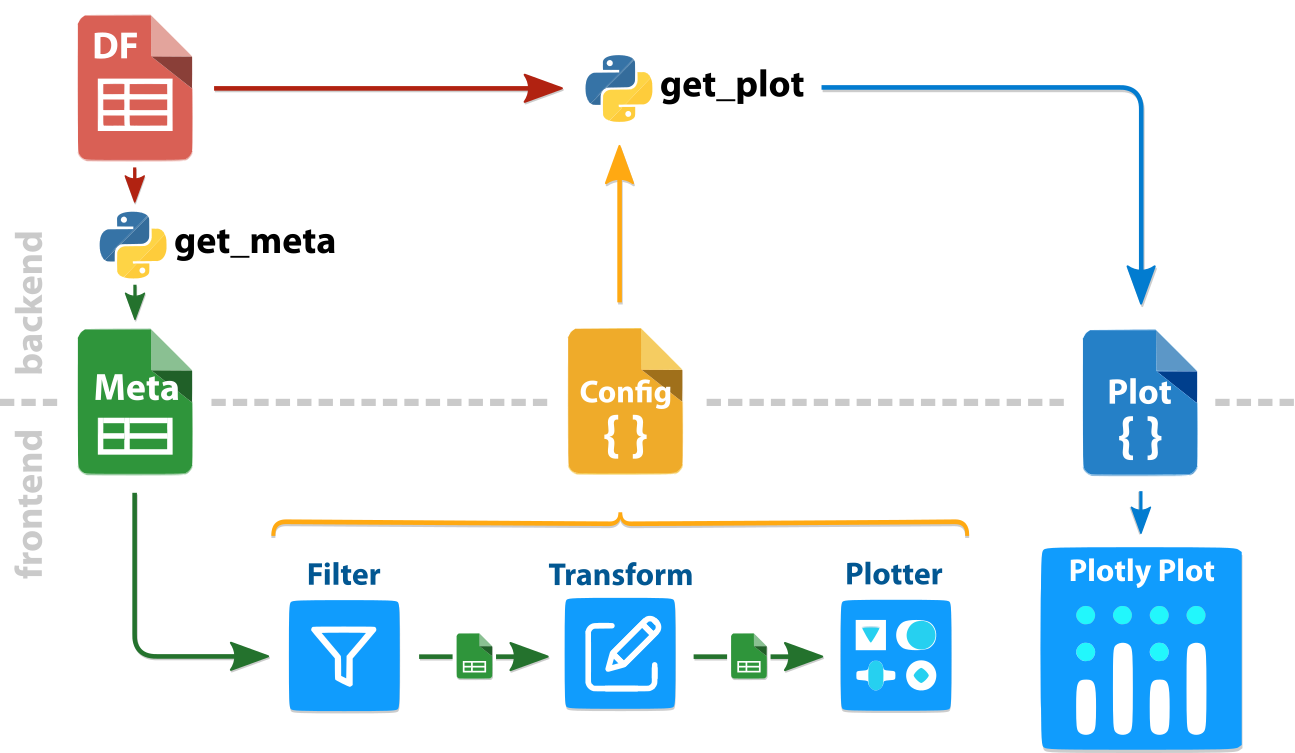 First, the metadata is extracted from the dataframe ***df*** with **dxc.get_meta(*df*)**. This ***meta*** json is needed for
[**dxc.Filter**](https://vk.github.io/dash-express-components/Filter.html),
[**dxc.Transform**](https://vk.github.io/dash-express-components/Transform.html) or [**dxc.Plotter**](https://vk.github.io/dash-express-components/Plotter.html) to show all options without additional queries to the dataframe. As a result, the components react quite quickly.
Since the metadata can be changed by filter or transform operations, and we don't want additional server calls, the changes are directly computed in the web components. You can access the metadata after transformations via the ***meta_out*** property of [**dxc.Filter**](https://vk.github.io/dash-express-components/Filter.html) and [**dxc.Transform**](https://vk.github.io/dash-express-components/Transform.html).
A combined ***config*** is needed to compute the final plot with **dxc.get_plot(*df*, *config*)**. You can combine the configurations of each component yourself or use the [**dxc.Configurator**](https://vk.github.io/dash-express-components/Configurator.html) to get a combined configuration like:
First, the metadata is extracted from the dataframe ***df*** with **dxc.get_meta(*df*)**. This ***meta*** json is needed for
[**dxc.Filter**](https://vk.github.io/dash-express-components/Filter.html),
[**dxc.Transform**](https://vk.github.io/dash-express-components/Transform.html) or [**dxc.Plotter**](https://vk.github.io/dash-express-components/Plotter.html) to show all options without additional queries to the dataframe. As a result, the components react quite quickly.
Since the metadata can be changed by filter or transform operations, and we don't want additional server calls, the changes are directly computed in the web components. You can access the metadata after transformations via the ***meta_out*** property of [**dxc.Filter**](https://vk.github.io/dash-express-components/Filter.html) and [**dxc.Transform**](https://vk.github.io/dash-express-components/Transform.html).
A combined ***config*** is needed to compute the final plot with **dxc.get_plot(*df*, *config*)**. You can combine the configurations of each component yourself or use the [**dxc.Configurator**](https://vk.github.io/dash-express-components/Configurator.html) to get a combined configuration like:
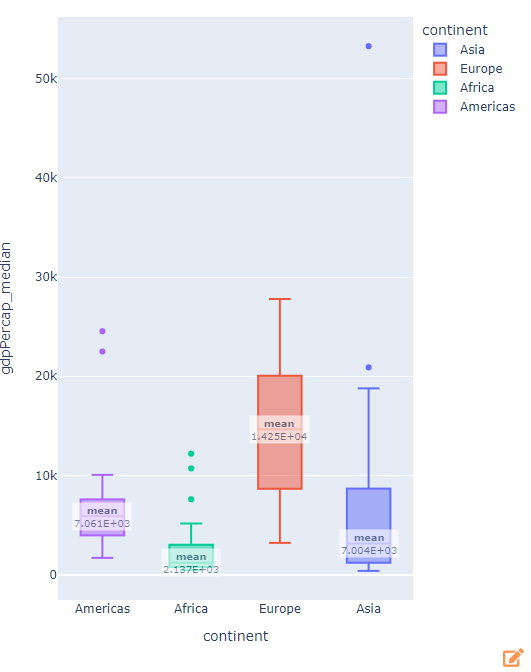 ```python
{
"filter": [
{
"col": "continent",
"type": "isnotin",
"value": ["Oceania"]
}
],
"transform": [
{
"type": "aggr",
"groupby": [
"country",
"continent"
],
"cols": ["gdpPercap"],
"types": ["median"]
}
],
"plot": {
"type": "box",
"params": {
"x": "continent",
"y": "gdpPercap_median",
"color": "continent",
"aggr": ["mean"],
"reversed_x": True
}
}
}
```
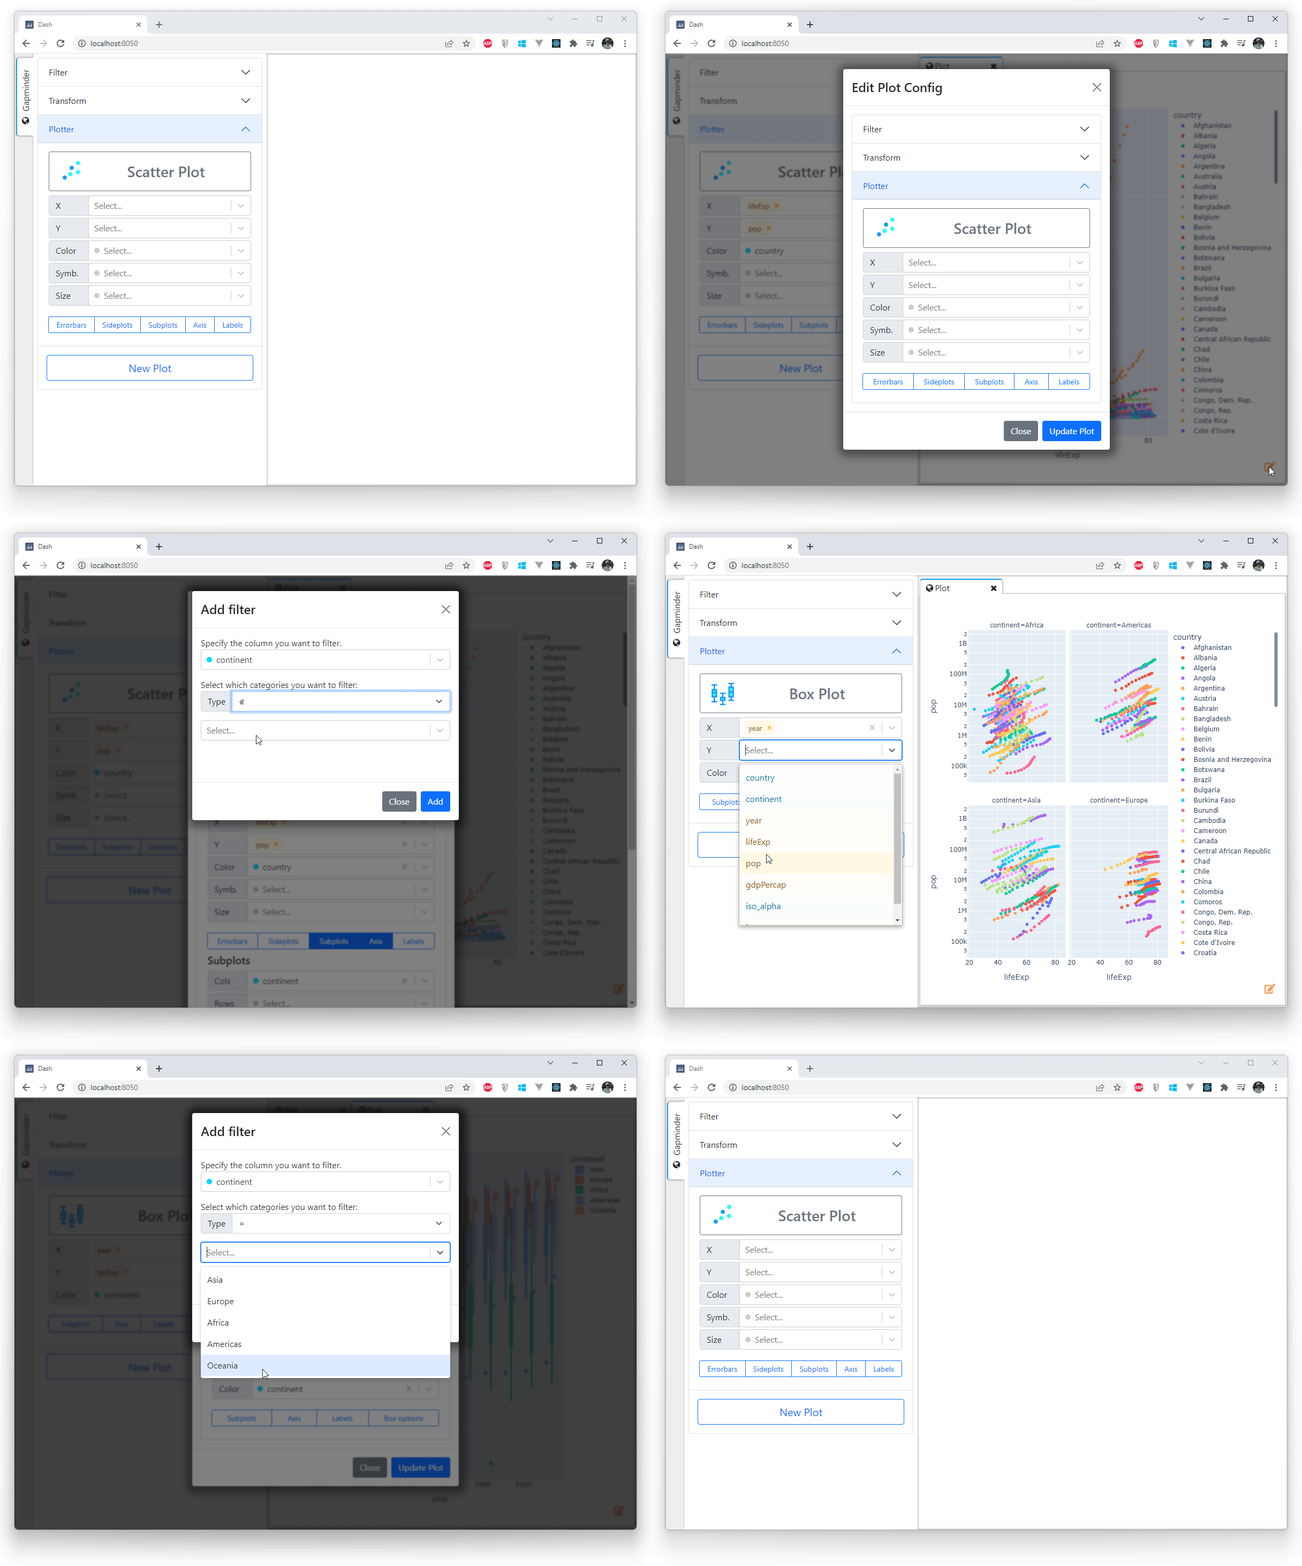
An example with the gapminder dataset and [**dash-lumino-components**](https://github.com/VK/dash-lumino-components) for the MDI layout.
## Try it
Install dependencies
```console
$ pip install dash-express-components
```
and start with quickly editable graphs:
```python
import dash_express_components as dxc
app.layout = html.Div([
# add a plot dxc.Configurator
html.Div([
dxc.Configurator(
id="plotConfig",
meta=meta,
),
], style={"width": "500px", "float": "left"}),
# add an editable dxc.Graph
html.Div([
dxc.Graph(id="fig",
meta=meta,
style={"height": "100%", "width": "100%"}
)],
style={"width": "calc(100% - 500px)", "height": "calc(100vh - 30px)",
"display": "inline-block", "float": "left"}
)
])
```
## Develop
1. Install npm packages
```console
$ npm install
```
2. Create a virtual env and activate.
```console
$ virtualenv venv
$ . venv/bin/activate
```
_Note: venv\Scripts\activate for windows_
3. Install python packages required to build components.
```console
$ pip install -r requirements.txt
```
4. Build your code
```console
$ npm run build
```
5. Run the example
```console
$ python usage.py
```
---
_Source: https://npm.io/package/dash_express_components · Machine-readable twin of the npm.io package page. Health data is recomputed on every publish._
```python
{
"filter": [
{
"col": "continent",
"type": "isnotin",
"value": ["Oceania"]
}
],
"transform": [
{
"type": "aggr",
"groupby": [
"country",
"continent"
],
"cols": ["gdpPercap"],
"types": ["median"]
}
],
"plot": {
"type": "box",
"params": {
"x": "continent",
"y": "gdpPercap_median",
"color": "continent",
"aggr": ["mean"],
"reversed_x": True
}
}
}
```
An example with the gapminder dataset and [**dash-lumino-components**](https://github.com/VK/dash-lumino-components) for the MDI layout.

## Try it
Install dependencies
```console
$ pip install dash-express-components
```
and start with quickly editable graphs:
```python
import dash_express_components as dxc
app.layout = html.Div([
# add a plot dxc.Configurator
html.Div([
dxc.Configurator(
id="plotConfig",
meta=meta,
),
], style={"width": "500px", "float": "left"}),
# add an editable dxc.Graph
html.Div([
dxc.Graph(id="fig",
meta=meta,
style={"height": "100%", "width": "100%"}
)],
style={"width": "calc(100% - 500px)", "height": "calc(100vh - 30px)",
"display": "inline-block", "float": "left"}
)
])
```
## Develop
1. Install npm packages
```console
$ npm install
```
2. Create a virtual env and activate.
```console
$ virtualenv venv
$ . venv/bin/activate
```
_Note: venv\Scripts\activate for windows_
3. Install python packages required to build components.
```console
$ pip install -r requirements.txt
```
4. Build your code
```console
$ npm run build
```
5. Run the example
```console
$ python usage.py
```
---
_Source: https://npm.io/package/dash_express_components · Machine-readable twin of the npm.io package page. Health data is recomputed on every publish._