# native-canvas-chart
> Chart based on HTML5 canvas
Latest version **1.0.9** (published 2019-04-03) · ISC license · 0 weekly downloads
## Install
```sh
npm install native-canvas-chart
pnpm add native-canvas-chart
yarn add native-canvas-chart
bun add native-canvas-chart
```
## Health
**Score 15/100 (F)** — status: abandoned.
Positive: no vulnerabilities.
Warnings: low downloads; no types; no esm support.
Negative: abandoned; low maintenance score.
## Facts
| | |
|---|---|
| Version | 1.0.9 |
| Published | 2019-04-03 |
| First published | 2019-03-27 |
| Weekly downloads | 0 |
| License | ISC |
| TypeScript types | none |
| Module format | CommonJS |
| Dependencies | 0 |
| Unpacked size | 7.1 MB |
| Known vulnerabilities | 0 |
| Install scripts | no |
| Author | Aleksander Simonov |
| Maintainers | fatalius |
| Keywords | chart, html5, canvas |
## Links
- npm: https://www.npmjs.com/package/native-canvas-chart
- npm.io page: https://npm.io/package/native-canvas-chart
## Alternatives
- [d3-force-3d](https://npm.io/package/d3-force-3d.md) — 1.0M weekly downloads
- [ng2-charts](https://npm.io/package/ng2-charts.md) — 486.8K weekly downloads
- [@arcgis/core](https://npm.io/package/@arcgis/core.md) — 257.8K weekly downloads
- [react-sparklines](https://npm.io/package/react-sparklines.md) — 249.3K weekly downloads
- [react-native-gifted-charts](https://npm.io/package/react-native-gifted-charts.md) — 182.3K weekly downloads
## Recent versions
- 1.0.9 (latest) — 2019-04-03
- 1.0.8 — 2019-04-03
- 1.0.7 — 2019-04-02
- 1.0.6 — 2019-03-27
- 1.0.5 — 2019-03-27
- 1.0.4 — 2019-03-27
- 1.0.3 — 2019-03-27
- 1.0.2 — 2019-03-27
- 1.0.1 — 2019-03-27
- 1.0.0 — 2019-03-27
## README
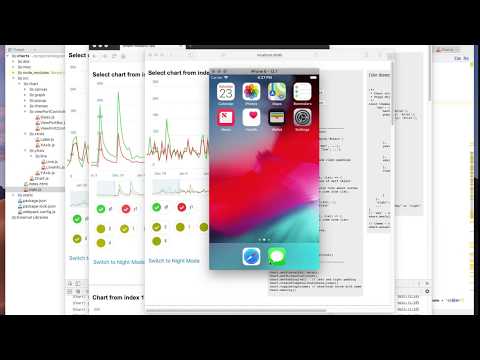
# HTML5 canvas based chart
[](https://www.youtube.com/watch?v=IXBad2LEVjA)
# INSTALL
```
npm install native-canvas-chart
```
# Usage
```
import Chart from 'native-canvas-chart'
let el = document.getElementById('#chart')
let options = {
monthes: ['Jan', 'Feb', 'Mar', ...],
weekDays: ['Sun', 'Mon', 'Tue', ...],
width: 500,
height: 500,
padding: 10, // left and right paddings
yAxis: {
linesCount: 5
},
callbacks: {
graphsCreated: (chart, list) => {
// chart = instance of self object
//
// list - array with info about curves
// example of one item from list:
// {
// name: 'y0',
// data: [0,23,432...],
// color: '#ffffff'
// }
},
graphsChanged: (chart, list) => {
// example of one item from list:
// {
// name: 'y0',
// enabled: true,
// }
}
}
}
// append canvas to el
let chart = new Chart(el, [options])
```
# Methods
```
chart.setSize(width, height)
chart.setYLinesCount(count)
chart.setPadding(val) // left and right padding
chart.createFromData(chartsData[index])
chart.toggleGraph(name) // show/hide curve with name
chart.destroy()
```
# Color themes
```
/**
* Chart color themes
* @type Object
*/
const themes = {
'day': {
backgroundColor: '#ffffff',
popup: {
backgroundColor: '#ffffff',
backgroundOpacity: 0.7,
dateColor: '#000000',
dateFont: {size : 12, family: 'Arial'},
axisNameFont: {size : 12, family: 'Arial'},
axisValueFont: {size : 16, family: 'Arial'},
currentValueLineColor: '#dbe3e9'
},
yAxis: {
textColor: '#818f99',
lineColor: '#eaeef2'
},
xAxis: {
textColor: '#88969f'
},
viewController: {
navbar: {
backgroundColor: '#ddeaf3',
viewportColor: '#ffffff',
glassColor: '#dce8ee',
glassOpacity: 0.5
}
}
},
'night': { ...
...
}
// 'day' - selected theme
chart.setColorThemes(themes, 'day')
// theme - theme name, in current example "day" or "night"
chart.selectTheme(theme)
```
---
_Source: https://npm.io/package/native-canvas-chart · Machine-readable twin of the npm.io package page. Health data is recomputed on every publish._