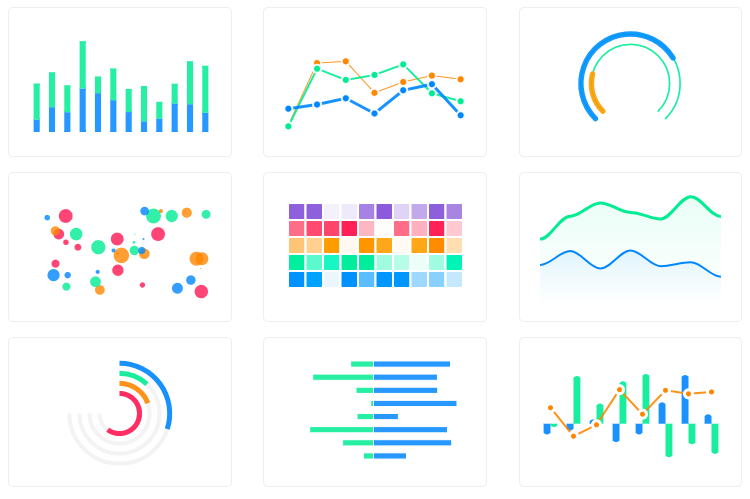
Angular wrapper for ApexCharts to build interactive visualizations in Angular.
## Built for modern Angular
Everything here is standalone components and signals. There are no NgModules to
register and no decorators in the public API.
- **Standalone components**: import `ChartComponent` where you use it.
- **Signal inputs** (`input()`) and the **`output()`** API throughout. No
`@Input()`, `@Output()`, `@ViewChild()`, or `ngOnChanges` anywhere.
- **Zoneless ready**: runs under `provideZonelessChangeDetection()`, and the
whole test suite is executed that way. ApexCharts' own rendering is kept
outside the Angular zone so it never schedules change detection.
- **`OnPush`** change detection, with chart creation scheduled via
`afterNextRender` so layout is measured only once it is final.
- **SSR + hydration** via `` / ``.
- **Tree-shakeable** entry point via ``.
- `chartInstance` is exposed as a **signal**, so you can `computed()` or
`effect()` off the underlying ApexCharts object.
## Angular Version Compatibility
| ng-apexcharts Version | Angular Version | ApexCharts Version |
| --------------------- | --------------- | -------------------- |
| 3.1.x | 20+ | ^6.0.0 \|\| ^7.0.0 |
| 3.0.x | 20+ | ^6.0.0 |
| 2.5.x | 20+ | ^5.10.3 \|\| ^6.0.0 |
| 2.4.x | 20+ | ^5.10.3 \|\| ^6.0.0 |
| 2.3.x | 20+ | ^5.10.3 |
| 2.2.x | 20+ | ^5.10.3 |
| 2.0.x - 2.1.x | 20+ | ^5.3.2 |
| 1.16.x - 1.17.x | 20.x | >=4.0.0 |
| 1.14.x - 1.15.x | 19.x | >=4.0.0 |
| 1.11.x - 1.13.x | 18.x | ^3.49.1 - ^4.0.0 |
| 1.9.x - 1.10.x | 17.x | ^3.45.2 |
| 1.7.x - 1.8.x | 13+ | ^3.40.0 - ^3.41.0 |
| 1.6.x | 9.x - 12.x | ^3.31.0 |
**Note:** For projects using older Angular versions (7-8), please use ng-apexcharts version 1.5.x or earlier.
ng-apexcharts 3.1+ works with ApexCharts 6 or 7. All option types (`ApexChart`,
`ApexPlotOptions`, and the rest) are re-exported directly from the installed
`apexcharts` package, so they always match its actual API
([#504](https://github.com/apexcharts/ng-apexcharts/issues/504)).
ApexCharts 7 moved nine optional features out of its default bundle, so if you
use one, import it alongside ApexCharts (this is an ApexCharts-level change, not
an ng-apexcharts API change):
```ts
import 'apexcharts/features/trellis'
```
The affected features are trellis, storyboard, perspectives, ink,
renderer-canvas, link, measure, history and context-menu. Each warns in the
console when its config is set but the feature is absent. If you must
stay on ApexCharts 5.x, use ng-apexcharts 2.5.x; note that apexcharts 5.16.0
ships broken drilldown type declarations
([#493](https://github.com/apexcharts/ng-apexcharts/issues/493)).
## Installation
```bash
ng add ng-apexcharts
```
That installs a compatible `apexcharts` release alongside the wrapper. Or do it
by hand:
```bash
npm install apexcharts ng-apexcharts --save
```
There is nothing to add to `angular.json` and nothing to register in your
application config. The chart components load the ApexCharts bundle themselves
through a dynamic `import()`, so no global script tag is needed.
> **Upgrading?** If an older `ng add` put
> `node_modules/apexcharts/dist/apexcharts.min.js` into the `scripts` array of
> your `angular.json`, remove it. It is redundant, adds roughly 940 KB to every
> build, and prevents `` from shrinking your bundle. Re-running
> `ng add ng-apexcharts` cleans it up for you.
## Usage
Import the component and use it in your template:
```ts
import { Component, signal } from "@angular/core";
import {
ChartComponent,
ApexAxisChartSeries,
ApexChart,
ApexXAxis,
ApexTitleSubtitle,
} from "ng-apexcharts";
@Component({
selector: "app-revenue-chart",
imports: [ChartComponent],
template: `
`,
})
export class RevenueChartComponent {
readonly series = signal([
{ name: "Revenue", data: [10, 41, 35, 51, 49, 62, 69, 91, 148] },
]);
readonly chart: ApexChart = { type: "bar", height: 350 };
readonly title: ApexTitleSubtitle = { text: "Monthly Revenue" };
readonly xaxis: ApexXAxis = {
categories: ["Jan", "Feb", "Mar", "Apr", "May", "Jun", "Jul", "Aug", "Sep"],
};
}
```
You need at least `series` and `chart` for a meaningful chart.
### Updating the chart
Set a new value on the signal (or change the bound input) and the chart updates
itself. There is no need to call `updateSeries()` or `updateOptions()` manually:
```ts
addMonth() {
this.series.update((current) => [
{ ...current[0], data: [...current[0].data, 120] },
]);
}
```
Changing **only** `series` runs the cheap `updateSeries()` path, which animates
in place and keeps the same chart instance. Changing any other option rebuilds
the chart. If both change together, the rebuild wins and happens once.
Set `[autoUpdateSeries]="false"` to opt out of the in-place series update and
always rebuild. This matters for mixed/combo charts where you change the `type`
inside the series objects themselves.
### Inputs
Each input maps to the matching key of the ApexCharts config object. All are
signal inputs, so read them with `chart()` in your own code:
| Input | Type |
| -------------------- | --------------------------------------------- |
| `chart` | `ApexChart` |
| `series` | `ApexAxisChartSeries \| ApexNonAxisChartSeries` |
| `annotations` | `ApexAnnotations` |
| `colors` | `any[]` |
| `dataLabels` | `ApexDataLabels` |
| `stroke` | `ApexStroke` |
| `labels` | `string[]` |
| `legend` | `ApexLegend` |
| `markers` | `ApexMarkers` |
| `noData` | `ApexNoData` |
| `parsing` | `ApexParsing` |
| `fill` | `ApexFill` |
| `tooltip` | `ApexTooltip` |
| `plotOptions` | `ApexPlotOptions` |
| `responsive` | `ApexResponsive[]` |
| `xaxis` | `ApexXAxis` |
| `yaxis` | `ApexYAxis \| ApexYAxis[]` |
| `forecastDataPoints` | `ApexForecastDataPoints` |
| `grid` | `ApexGrid` |
| `states` | `ApexStates` |
| `title` | `ApexTitleSubtitle` |
| `subtitle` | `ApexTitleSubtitle` |
| `theme` | `ApexTheme` |
| `autoUpdateSeries` | `boolean` (default `true`) |
See the [ApexCharts docs](https://apexcharts.com/docs/) for what each option accepts.
### Outputs and the chart instance
| Member | Type | Description |
| --------------- | ----------------------------------------- | ----------------------------------------------- |
| `chartReady` | `output<{ chartObj: ApexCharts }>` | Emits after each successful render. |
| `chartInstance` | `Signal` | The live ApexCharts object, or `null` before it exists. |
Because `chartInstance` is a signal, you can react to it declaratively:
```ts
import { Component, computed, viewChild } from "@angular/core";
import { ChartComponent } from "ng-apexcharts";
@Component({
imports: [ChartComponent],
template: ``,
})
export class DashboardComponent {
private readonly chartCmp = viewChild.required(ChartComponent);
readonly isRendered = computed(() => this.chartCmp().chartInstance() !== null);
}
```
### Calling ApexCharts methods
Every method is proxied through the component, so you never need to touch the
DOM. Grab the component with `viewChild` and call it:
```ts
import { Component, viewChild } from "@angular/core";
import { ChartComponent } from "ng-apexcharts";
@Component({
imports: [ChartComponent],
template: `
`,
})
export class DashboardComponent {
private readonly chart = viewChild.required(ChartComponent);
toggle() {
this.chart().toggleSeries("Revenue");
}
}
```
Available methods: `render`, `updateOptions`, `updateSeries`, `appendSeries`,
`appendData`, `highlightSeries`, `toggleSeries`, `showSeries`, `hideSeries`,
`resetSeries`, `zoomX`, `toggleDataPointSelection`, `destroy`, `setLocale`,
`paper`, `addXaxisAnnotation`, `addYaxisAnnotation`, `addPointAnnotation`,
`removeAnnotation`, `clearAnnotations`, `dataURI`.
Reference for the underlying behaviour lives in the
[ApexCharts methods docs](https://apexcharts.com/docs/methods/).
### Calling methods without a component reference
To reach a chart from somewhere else entirely, use the global `exec()` and
target the chart by its `chart.id`:
```ts
window.ApexCharts.exec("ng-chart-example", "updateSeries", [
{ data: [40, 55, 65, 11, 23, 44, 54, 33] },
]);
```
The component assigns `window.ApexCharts` when it loads its bundle, so this
works without a global script tag. More on
[`.exec()`](https://apexcharts.com/docs/methods/#exec).
## Tree-Shaking (reduced bundle size)
Use `` instead of `` to load the ApexCharts core
bundle (~611 KB gzipped) instead of the full bundle (~942 KB). Register only the
chart types you need with side-effect imports:
```ts
import "apexcharts/line"; // line, area, scatter, bubble
import "apexcharts/bar"; // bar, column, rangeBar
import "apexcharts/features/legend"; // opt-in legend
import "apexcharts/features/toolbar"; // opt-in toolbar
```
```ts
import { ChartCoreComponent } from "ng-apexcharts";
@Component({
imports: [ChartCoreComponent],
template: ``,
})
export class LeanChartComponent {}
```
All inputs, outputs, and methods are identical to ``.
## Server-Side Rendering (SSR)
ng-apexcharts supports Angular SSR out of the box via two companion components.
### ``: renders the chart on the server
```ts
import { ChartSSRComponent } from "ng-apexcharts";
@Component({
imports: [ChartSSRComponent],
template: ``,
})
export class StaticChartComponent {}
```
The `options` input accepts a single `ApexOptions` object (all chart config combined).
### ``: attaches interactivity on the client
Place it immediately after `` in the same container:
```html
```
`clientOptions` is merged by ApexCharts during hydration and can be used to
override options that only make sense in the browser (animations, tooltips, etc.).
### `ChartSSRService`: server-side rendering service
Injectable service for generating chart HTML or SVG strings on the server:
```ts
import { ChartSSRService } from "ng-apexcharts";
const html = await chartSSRService.renderToHTML(options, { width: 800, height: 400 });
const svg = await chartSSRService.renderToString(options, { width: 800, height: 400 });
```
## Using NgModules
New code should import the standalone components directly. If your application
is still NgModule-based, `NgApexchartsModule` re-exports all four components:
```ts
import { NgApexchartsModule } from "ng-apexcharts";
@NgModule({
imports: [NgApexchartsModule],
})
export class AppModule {}
```
It exists only for backwards compatibility. Do not add it to a standalone
application's providers via `importProvidersFrom()`: it declares no providers,
so that has no effect and leaves `` unresolved in your templates.
## Examples
More than 80+ examples of all the chart types with sample code are on the
[Angular Demos](https://apexcharts.com/angular-chart-demos/) page.
---
_Source: https://npm.io/package/ng-apexcharts · Machine-readable twin of the npm.io package page. Health data is recomputed on every publish._