# qk-chart
> 这是一款移动端图表插件利用canvas进行绘制,包含柱状图、折线图、饼图、分时图、K线图。
Latest version **1.0.8** (published 2022-10-07) · lzh license · 0 weekly downloads
## Install
```sh
npm install qk-chart
pnpm add qk-chart
yarn add qk-chart
bun add qk-chart
```
## Health
**Score 15/100 (F)** — status: abandoned.
Positive: no vulnerabilities.
Warnings: low downloads; no types; no esm support.
Negative: abandoned; low maintenance score.
## Facts
| | |
|---|---|
| Version | 1.0.8 |
| Published | 2022-10-07 |
| First published | 2022-10-04 |
| Weekly downloads | 0 |
| License | lzh |
| TypeScript types | none |
| Module format | CommonJS |
| Dependencies | 0 |
| Unpacked size | 65.7 KB |
| Known vulnerabilities | 0 |
| Install scripts | no |
| Maintainers | mylzhx |
## Links
- npm: https://www.npmjs.com/package/qk-chart
- npm.io page: https://npm.io/package/qk-chart
## Recent versions
- 1.0.8 (latest) — 2022-10-07
- 1.0.7 — 2022-10-06
- 1.0.6 — 2022-10-05
- 1.0.5 — 2022-10-05
- 1.0.4 — 2022-10-04
- 1.0.3 — 2022-10-04
- 1.0.2 — 2022-10-04
- 1.0.1 — 2022-10-04
- 1.0.0 — 2022-10-04
## README
## 简介
这是一款移动端图表插件利用canvas进行绘制,包含柱状图、折线图、饼图、分时图、K线图。
## 用法
```
npm install qk-chart
import qkChart from 'qk-chart'
Vue.use(qkChart)
```
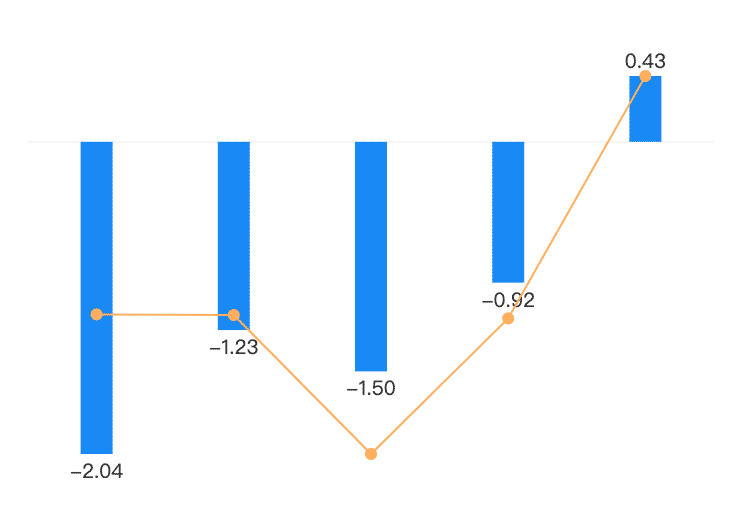
## 柱状图使用示例
#### 单柱模式
```html
```
```js
// 单柱数据格式
// value 柱体数据 || value_yoy 折线数据
this.list = [
{ value: "-2.04", value_yoy: "40.13" },
{ value: "-1.23", value_yoy: "39.84" },
{ value: "-1.50", value_yoy: "-22.13" },
{ value: "-0.92", value_yoy: "38.35" },
{ value: "0.43", value_yoy: "146.44" }
]
```
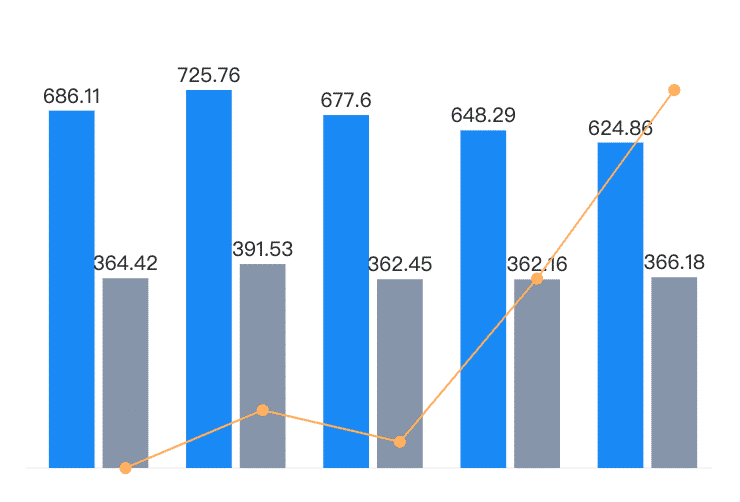
## 双柱模式
```html
```
```js
// 双柱数据格式
// value 首柱数据 || value_yoy 折线数据 || liab_ratio 尾柱数据
this.list = [
{ liab_ratio: "364.42", value_yoy: "53.11", value: 686.11 },
{ liab_ratio: "391.53", value_yoy: "53.95", value: 725.76 },
{ liab_ratio: "362.45", value_yoy: "53.49", value: 677.60 },
{ liab_ratio: "362.16", value_yoy: "55.86", value: 648.29 },
{ liab_ratio: "366.18", value_yoy: "58.60", value: 624.86 }
]
```
> 注意:只要传了 liab_ratio 自动会展示双柱,如果不需要双柱的不传即可。
| 属性 | 意思 | 默认值 |
| ---- | ---- | ---- |
| list | 数据格式 | [] |
| width | 画布宽度 | 0 |
| height | 画布高度 | 0 |
| fontSize | 数字大小 | 12 |
| isbLine | 是否起始线 | true |
| lineColor | 折线颜色 | #FDAF5E |
| isLine | 是否折线 | true |
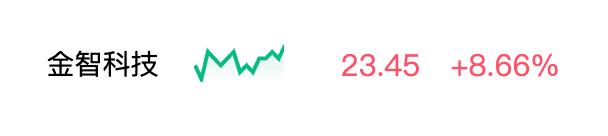
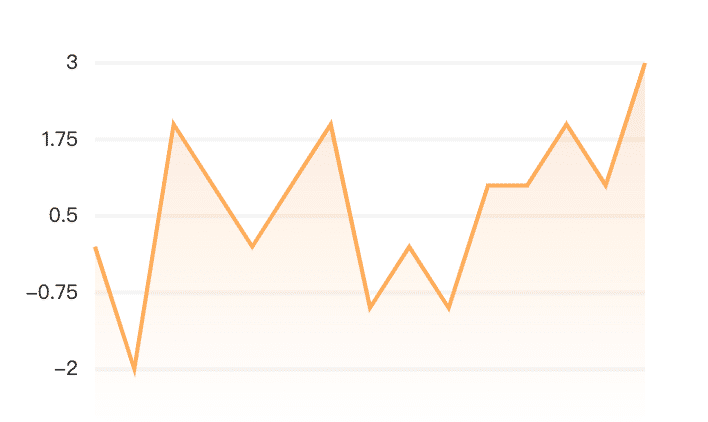
## 折线图使用示例
```html
```
```html
```
```js
// 折线图需传入以下格式
this.list = [
{ value: 10 },
{ value: 3 },
{ value: -5 },
{ value: 7 },
{ value: 12 },
]
```
| 属性 | 意思 | 默认值 |
| ---- | ---- | ---- |
| list | 数据格式 | [] |
| width | 画布宽度 | 0 |
| height | 画布高度 | 0 |
| isYtext | 是否显示刻度 | true |
| lineColor | 折线颜色 | #FDAF5E |
| bgColor | 折线底部渐变颜色 | 255,131,0 需要传rgb格式 |
| ml | 距离左边的距离 | 30 |
| mt | 距离上边的距离 | 30 |
| mr | 距离右边的距离 | 30 |
| mb | 距离下边的距离 | 30 |
| labelNum | y轴刻度需要画几条 | 5 |
| lineWidth | 折线厚度 | 1 |
| isBgColor | 是否展示渐变色 | true |
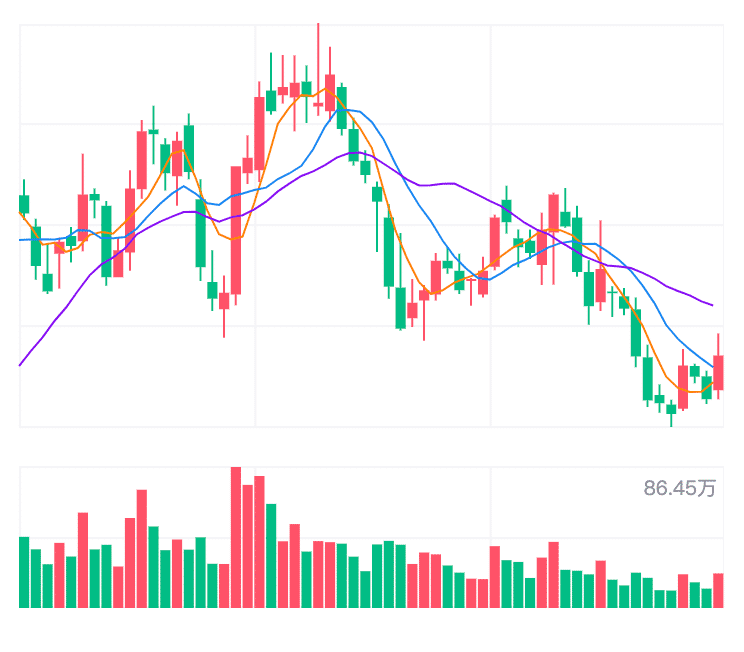
## K线图使用示例
```html
```
```js
this.list = [
[
'2022-06-28', 23.88, 22.77, 22.66, 23.55, 43939860, 22.798, 22.321, 20.188, 18.7843, 19.8003, -0.91, "10.1亿", 3.46, "43.94万"
]
]
/*
数据格式如上 下面进行下标说明
1: 开盘
2: 收盘
3: 最低
4: 最高
5: 成交量
6: MA5
7: MA10
8: MA20
14: 成交量总成交手数
此K线示例展示60日数据
*/
```
| 属性 | 意思 | 默认值 |
| ---- | ---- | ---- |
| list | 数据格式 | [] |
| width | 画布宽度 | 0 |
| height | 画布高度 | 0 |
| fiveDayColor | 五日均线颜色 | 默认为空 如果需要显示就传入颜色 |
| tenDayColor | 十日均线颜色 | 默认为空 如果需要显示就传入颜色 |
| twentyDayColor | 二十日均线颜色 | 默认为空 如果需要显示就传入颜色 |
| upColor | 涨柱颜色 | #FE5269 |
| downColor | 跌柱颜色 | #02BD85 |
| mineLineNum | 网格K线区横线绘制数量 | 4 |
| dealLineNum | 网格成交量区横线绘制数量 | 2 |
| verticalLineNum | 网格竖线绘制数量 | 3 |
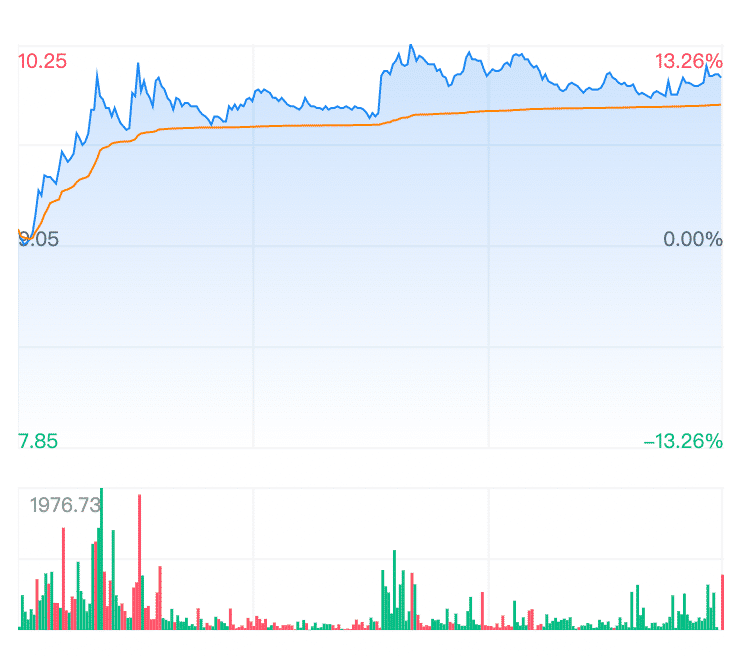
## 分时图使用示例
```html
```
```js
// 数据格式如下
base_info: {
prev_close_px: 9.05 // 昨收
}
list: [
['0930', 9.15, 9.15, 116, 59.3, 8.5]
]
/*
以下进行下标说明:
1: 折线点位
2: 均线点位
3: 成交量
成交量的红绿是由下标4 5决定的
4 < 5 ? 红 :绿
*/
```
| 属性 | 意思 | 默认值 |
| ---- | ---- | ---- |
| list | 数据格式 | [] |
| base_info | 昨收 | {} |
| width | 画布宽度 | 0 |
| height | 画布高度 | 0 |
| lineWidth | 折线宽度 | 1 |
| lineColor | 折线颜色 | #1988F4 |
| upColor | 成交量涨的颜色 | #FE5269 |
| downColor | 成交量跌的颜色 | #02BD85 |
| mineLineNum | 网格分时区横线绘制数量 | 4 |
| dealLineNum | 网格成交量区横线绘制数量 | 2 |
| verticalLineNum | 网格竖线绘制数量 | 3 |
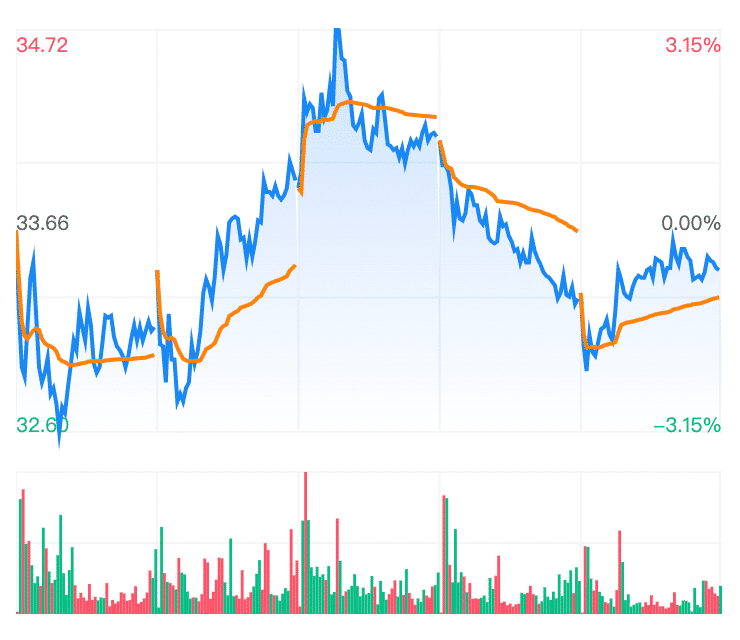
## 分时五日形态使用示例
```vue
```
```js
// 传入数据格式
this.list = {
"fiveSixDayClosePrice": 33.66, // 五日中间值
"fiveDayLine": {
"20220905": [
[
"0930",
33.66,
33.66,
140,
4,
6
],
[
"0935",
33.24,
33.4066,
7203,
156,
118
],
[
"0940",
32.94,
33.1791,
7815,
89,
109
],
]
}
}
/*
以下进行下标说明:
1: 折线点位
2: 均线点位
3: 成交量
成交量的红绿是由下标4 5决定的
4 < 5 ? 红 :绿
*/
```
| 属性 | 意思 | 默认值 |
| ---- | ---- | ---- |
| list | 数据格式 | {} |
| width | 画布宽度 | 0 |
| height | 画布高度 | 0 |
| lineWidth | 折线宽度 | 1 |
| lineColor | 折线颜色 | #1988F4 |
| upColor | 成交量涨的颜色 | #FE5269 |
| downColor | 成交量跌的颜色 | #02BD85 |
| mineLineNum | 网格分时区横线绘制数量 | 3 |
| dealLineNum | 网格成交量区横线绘制数量 | 2 |
| verticalLineNum | 网格竖线绘制数量 | 5 |
| averageColor | 均线颜色 | #FF8300 |
| bgColor | 背景渐变色 | 25,136,244 rgb格式 |
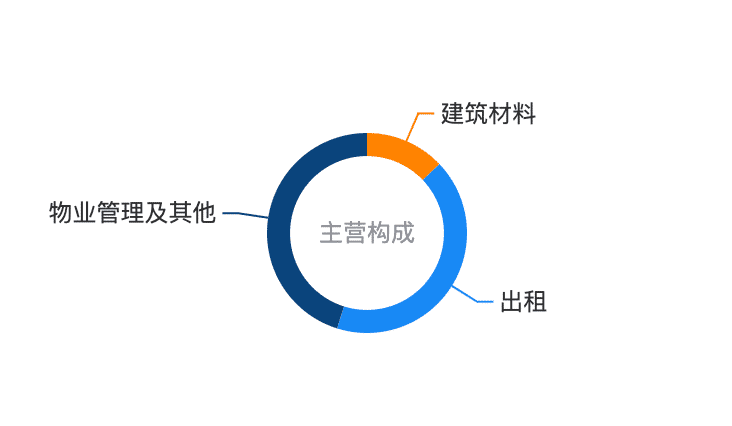
## 饼图使用示例
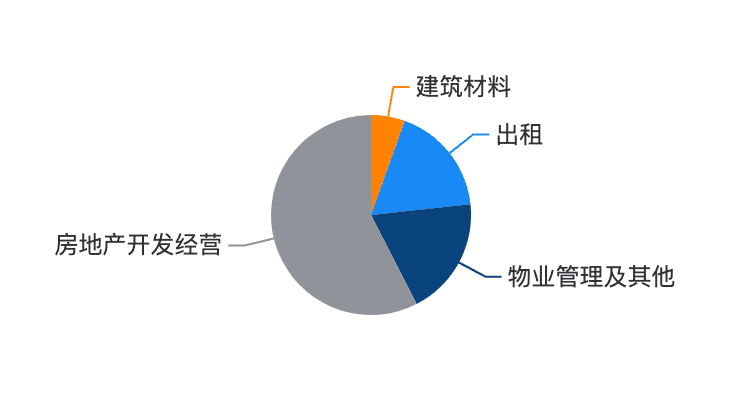
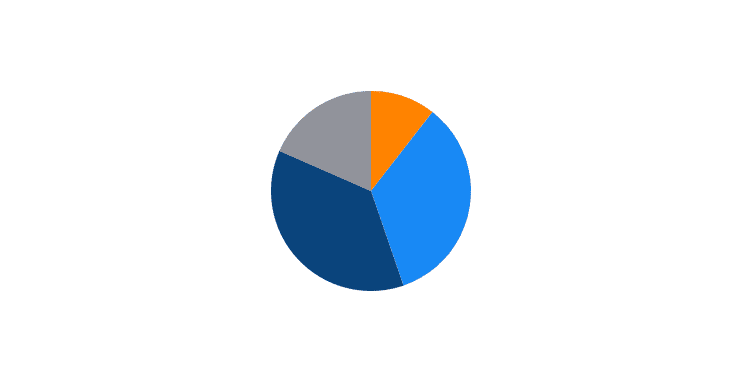
```vue
```
```js
// 传入数据格式
this.list = [
{ "income_ratio": "4.98", title: '建筑材料' },
{ "income_ratio": "13", title: '出租' },
{ "income_ratio": "7.45", title: '房地产开发经营' },
{ "income_ratio": "40.23", title: '物业管理及其他' },
]
```
| 属性 | 意思 | 默认值 |
| ---- | ---- | ---- |
| list | 数据格式 | [] |
| radius | 圆圈半径 | 0 |
| width | 画布宽度 | 0 |
| height | 画布高度 | 0 |
| colorList | 饼图颜色列表 | ['#FF8300', '#1988F4', '#0A447D', '#909399'] |
| title | 饼图中间文案 | '' 不传不显示中间白圈 |
| fontSize | 白圈文案字号大小 | 16 |
| textColor | 白圈文案颜色 | #909399 |
| bgColor | 白圈颜色 | 0 |
| lineSize | 提示线长度 | 0 |
| tipsSize | 提示字号大小 | 0 |
| tipsColor | 提示字颜色 | 0 |
| isTips | 是否显示提示线 | 0 |
---
_Source: https://npm.io/package/qk-chart · Machine-readable twin of the npm.io package page. Health data is recomputed on every publish._