# react-sensor-meters

> Library of common microcontroller sensor gauges

Latest version **2.0.2** (published 2024-07-16) · MIT license · 0 weekly downloads

## Install

```sh
npm install react-sensor-meters
pnpm add react-sensor-meters
yarn add react-sensor-meters
bun add react-sensor-meters
```

## Health

**Score 20/100 (F)** — status: abandoned.

Positive: esm support; no vulnerabilities.

Warnings: low downloads; no types.

Negative: abandoned; low maintenance score.

## Facts

| | |
|---|---|
| Version | 2.0.2 |
| Published | 2024-07-16 |
| First published | 2022-06-10 |
| Weekly downloads | 0 |
| License | MIT |
| TypeScript types | none |
| Module format | ESM + CommonJS |
| Dependencies | 0 |
| Unpacked size | 133.4 KB |
| Known vulnerabilities | 0 |
| Install scripts | no |
| Maintainers | chrismilheim |
| Keywords | react, components, ui, arduino, nodemcu, sensor, temperature, airquality, light, meter, gauge, humidity, water, battery, waterPlant, embedded, iot, internet of things, microcontroller, sensors, analog, digital, dashboard, monitoring, environment, smart, arduino uno, esp8266, esp32, dht11, dht22 |

## Links

- npm: https://www.npmjs.com/package/react-sensor-meters
- npm.io page: https://npm.io/package/react-sensor-meters

## Alternatives

- [@sindresorhus/slugify](https://npm.io/package/@sindresorhus/slugify.md) — 3.7M weekly downloads
- [solid-js](https://npm.io/package/solid-js.md) — 2.7M weekly downloads
- [expo-glass-effect](https://npm.io/package/expo-glass-effect.md) — 2.5M weekly downloads
- [nanoassert](https://npm.io/package/nanoassert.md) — 780.8K weekly downloads
- [@ffmpeg/ffmpeg](https://npm.io/package/@ffmpeg/ffmpeg.md) — 529.5K weekly downloads

## Recent versions

- 2.0.2 (latest) — 2024-07-16
- 2.0.1 — 2024-07-12
- 2.0.0 — 2024-07-10
- 1.0.0 — 2022-06-10

## README

## react-sensor-meters

Meter-like components for building homemade dashboards for your data loggers.

##### Demo

[LIVE DEMO!!!](https://chrismilheim.github.io/react-sensor-meters-demo/)

##### GitHub ( PRs welcome! :) )

https://github.com/chrismilheim/react-sensor-meters

I could not find React components that suited my needs for my Arduino/Nodemcu data logger dashboards, so I decided to publish the ones I've made. Hopefully you will also find value in some of them. Feel free to open a PR for new meters/fixes to existing meters/fixes to anything broken.

Shoutout to https://www.svgrepo.com for providing the svg files.
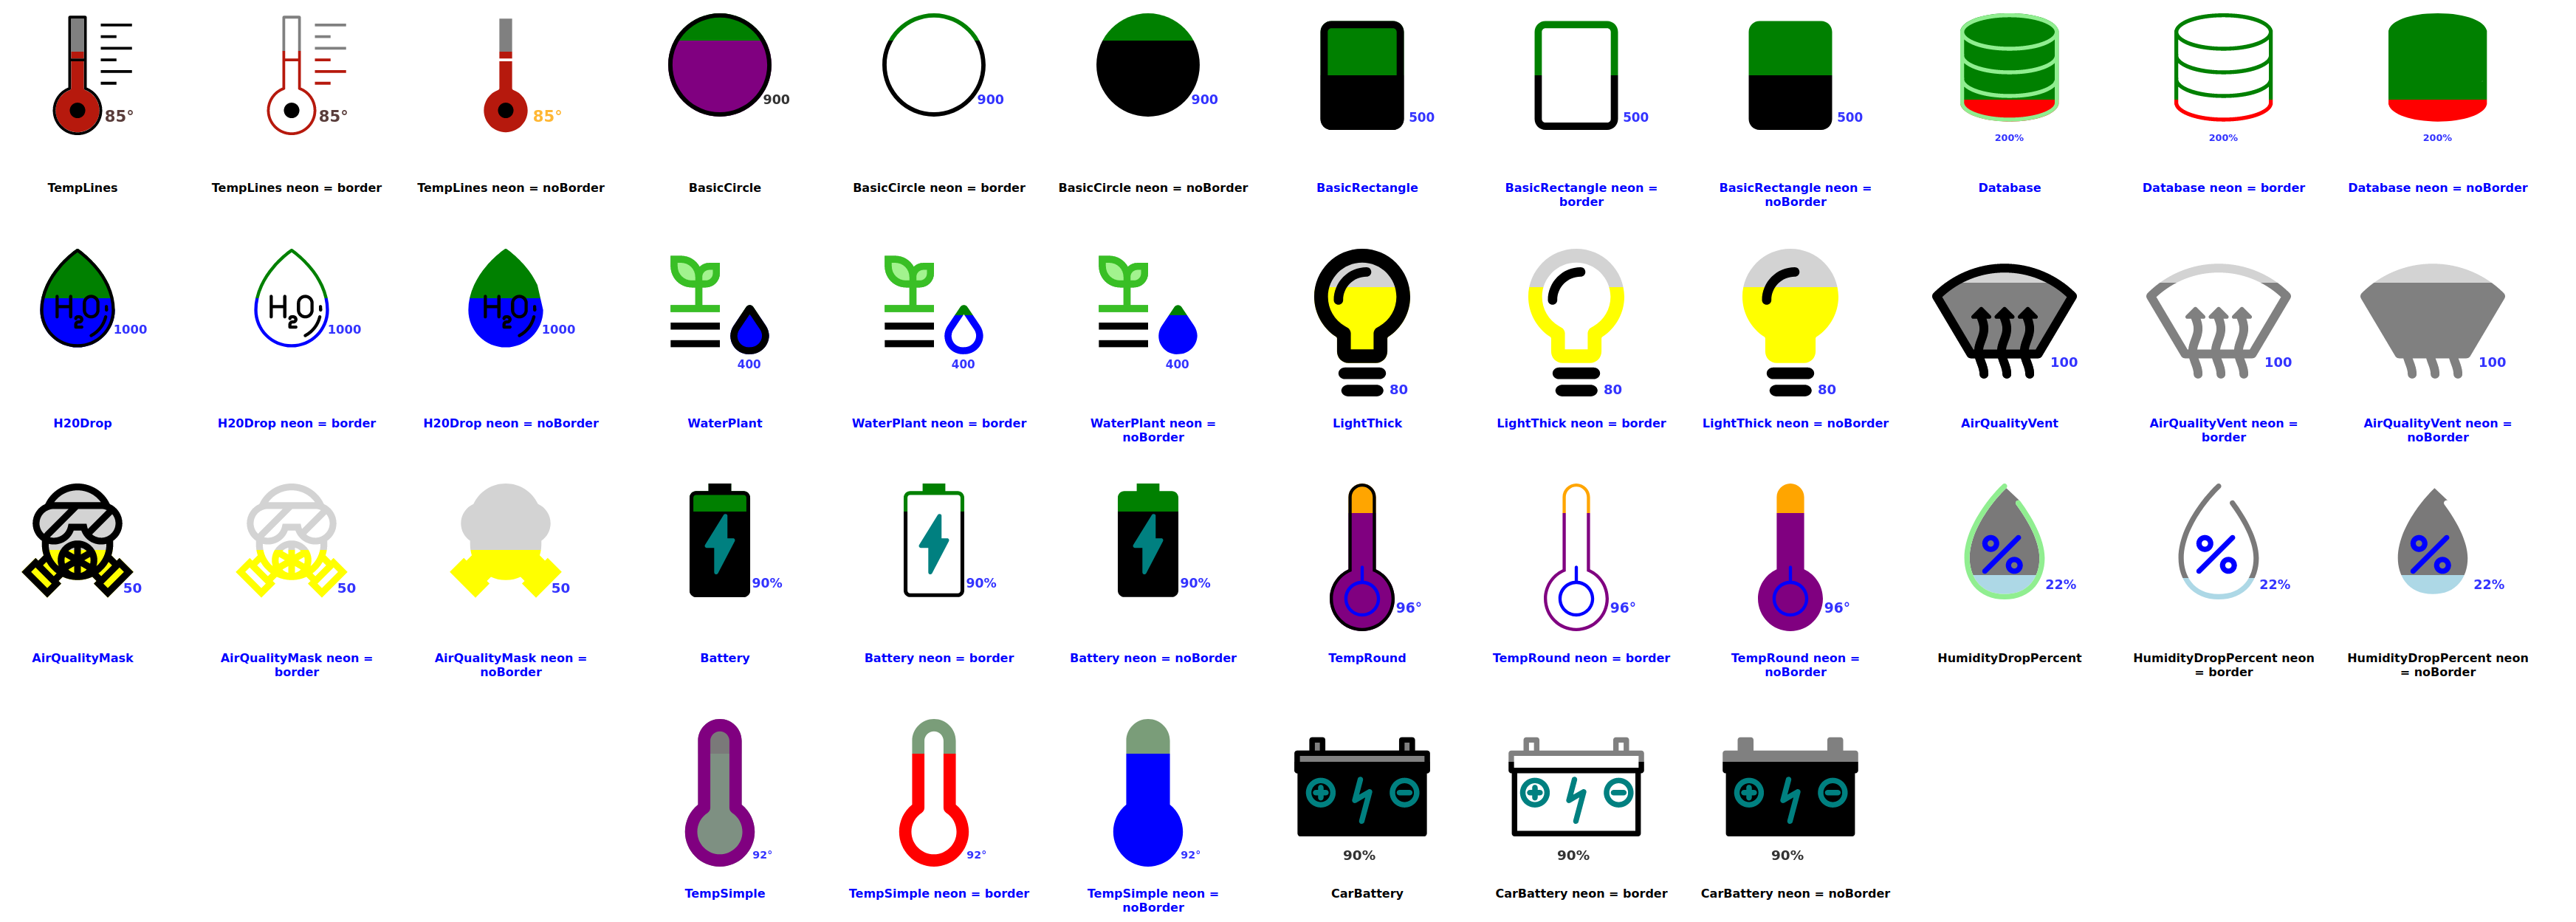
![alt text](https://github.com/chrismilheim/react-sensor-meters/blob/main/components/img/allMeters.png?raw=true)

##### Install

`npm install react-sensor-meters`

##### Import Example

```javascript
import { TempSimple, Battery, HumidityDropPercent } from "react-sensor-meters";
```

_Possible values for import:_

- TempLines
- TempRound
- TempSimple
- H20Drop
- WaterPlant
- LightThick
- HumidityDropPercent
- AirQualityMask
- AirQualityVent
- Battery
- CarBattery
- BasicCircle
- BasicRectangle
- _**NEW!**_ BasicNumber
- _**NEW!**_ BasicList

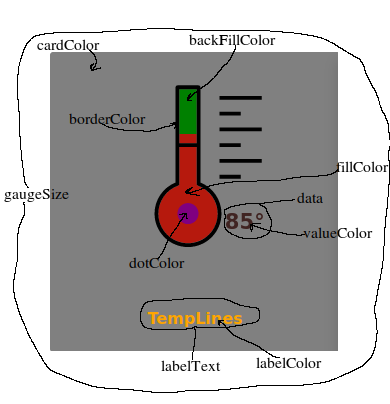
##### Props (\*_ in Prop Name = required _)

| Prop Name          | Value Type | Description                                                             | Possible Values                          | Examples                                   |
| ------------------ | ---------- | ----------------------------------------------------------------------- | ---------------------------------------- | ------------------------------------------ |
| data\*             | Number     | Value to be displayed.                                                  | Any Number                               | 58                                         |
| topEndDataLimit \* | Number     | Max value of data.                                                      | Any Number                               | 1000                                       |
| date\*             | String     | Value to be displayed.                                                  | Any String                               | "" or "12/25/2024" or "12/25/2024 11:45AM" |
| animate            | Boolean    | Animates the fill of the meter.                                         | true/false                               | true                                       |
| neon               | String     | Removes backfill on meter leaving only outline.                         | null, border, noBorder                   | "border"                                   |
| fillColor          | String     | Color of the fill.                                                      | Any string that can translate to a color | "grey" or "#ffff" or"rgba(1,1,1,1)"        |
| highFillColor      | String     | Use with highFillThreshhold. Changes fill color after a certian amount. | Any string that can translate to a color | “grey” or “#ffff” or”rgba(1,1,1,1)”        |
| highFillThreshold  | Number     | Use with highFillColor. Sets the threshhold for fill color change.      | Any number                               | 90                                         |
| backFillColor      | String     | Back fill color of meter.                                               | Any string that can translate to a color | “grey” or “#ffff” or”rgba(1,1,1,1)”        |
| dotColor           | String     | Special features of meter that do not fill (not all meters have one).   | Any string that can translate to a color | “grey” or “#ffff” or”rgba(1,1,1,1)”        |
| gaugeSize          | String     | Sets the size of the meter.                                             | small,medium,large                       | medium                                     |
| valueColor         | String     | Changes the color of the value displayed.                               | Any string that can translate to a color | "grey” or “#ffff” or”rgba(1,1,1,1)”        |
| labelColor         | String     | Changes the color of the label text.                                    | Any string that can translate to a color | "grey” or “#ffff” or”rgba(1,1,1,1)”        |
| cardColor          | String     | Changes the color of the div the gauge is on.                           | Any string that can translate to a color | "grey” or “#ffff” or”rgba(1,1,1,1)”        |
| hover              | Boolean    | On hover it increases meter size.                                       | true/false                               | true                                       |
| labelText          | String     | Text to be displayed under meter.                                       | Any string value                         | "Garage" or "Family Room"                  |
| borderColor        | String     | Color of the border of meter.                                           | Any string that can translate to a color | “grey” or “#ffff” or”rgba(1,1,1,1)”        |

Default colors are black on white if only using the required props.
![alt text](https://github.com/chrismilheim/react-sensor-meters/blob/main/components/img/propsBreakdown.png?raw=true)

## _Meters_

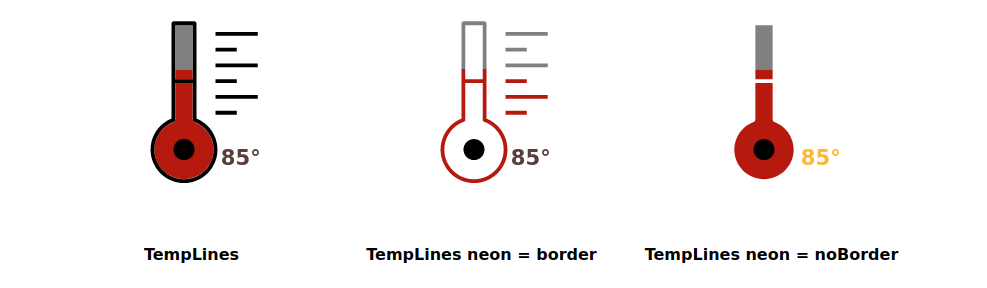
##### TempLines

![alt text](https://github.com/chrismilheim/react-sensor-meters/blob/main/components/img/tempLines.png?raw=true)

```javascript
<TempLines
  data={85}
  topEndDataLimit={120}
  date={"12/24/2024"}
  animate={false}
  neon={""}
  fillColor={"rgb(182, 25, 13)"}
  backFillColor={"green"}
  valueColor={"rgb(48, 13, 10)"}
  labelColor={"orange"}
  cardColor={"grey"}
  dotColor={"purple"}
  hover={true}
  gaugeSize={"medium"}
  labelText={"TempLines"}
  highFillColor={"purple"}
  highFillThreshold={95}
/>
```

---

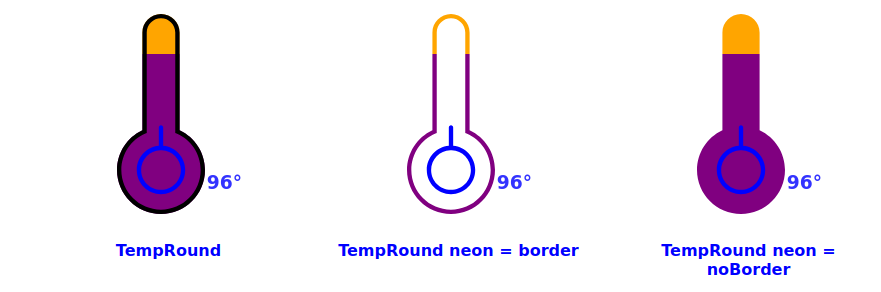
##### TempRound

![alt text](https://github.com/chrismilheim/react-sensor-meters/blob/main/components/img/tempRound.png?raw=true)

```javascript
<TempRound
  data={96}
  topEndDataLimit={120}
  date={"12/24/2024"}
  animate={true}
  neon={""}
  fillColor={"red"}
  backFillColor={"orange"}
  valueColor={"blue"}
  labelColor={"blue"}
  cardColor={"white"}
  dotColor={"blue"}
  hover={true}
  gaugeSize={"medium"}
  labelText={"TempRound"}
  highFillColor={"purple"}
  highFillThreshold={95}
/>
```

---

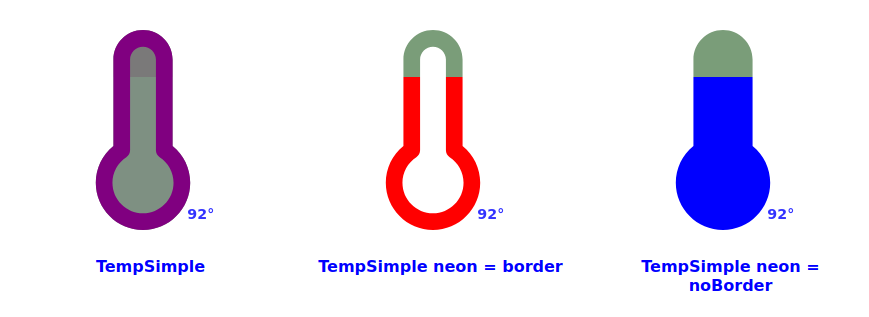
##### TempSimple

![alt text](https://github.com/chrismilheim/react-sensor-meters/blob/main/components/img/tempSimple.png?raw=true)

```javascript
<TempSimple
  data={92}
  topEndDataLimit={120}
  date={"12/24/2024"}
  animate={true}
  neon={""}
  fillColor={"rgba(49, 78, 55, 0.627)"}
  backFillColor={"rgba(43, 42, 42, 0.627)"}
  valueColor={"blue"}
  labelColor={"blue"}
  cardColor={"white"}
  dotColor={"blue"}
  hover={true}
  gaugeSize={"medium"}
  labelText={"TempSimple"}
  highFillColor={"purple"}
  highFillThreshold={95}
  borderColor={"purple"}
/>
```

---

##### H20Drop

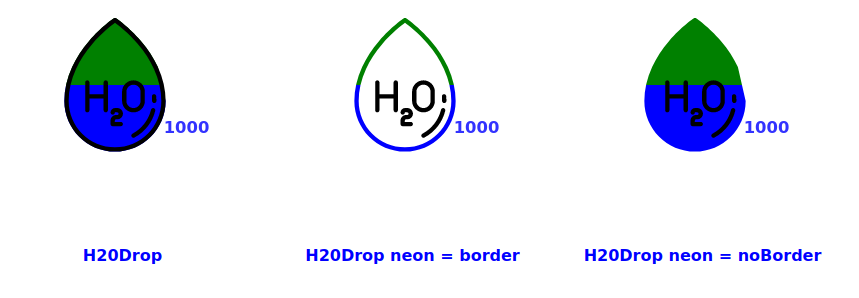
!!!! IMPORTANT !!!!!: Water detecting sensors work on an inverse. The higher the number means there is no presense of water. The lower the number means more of a presense of water. This corresponds to the resistance of the sensor.

This component operates on that principal. Give it a higher number, the meter will have low fill. Give it a lower number the meter will have more fill.
![alt text](https://github.com/chrismilheim/react-sensor-meters/blob/main/components/img/h20Drop.png?raw=true)

```javascript
<H2ODrop
  data={1000}
  topEndDataLimit={2000}
  date={"12/24/2024"}
  animate={false}
  neon={""}
  fillColor={"blue"}
  backFillColor={"green"}
  valueColor={"blue"}
  labelColor={"blue"}
  cardColor={"white"}
  dotColor={"black"}
  hover={false}
  gaugeSize={"medium"}
  labelText={"H20Drop"}
/>
```

---

##### WaterPlant

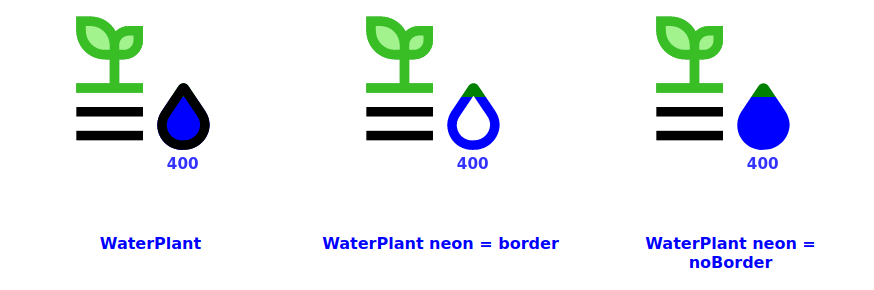
!!!! IMPORTANT !!!!!: Water detecting sensors work on an inverse. The higher the number means there is no presense of water. The lower the number means more of a presense of water. This corresponds to the resistance of the sensor.

This component operates on that principal. Give it a higher number, the meter will have low fill. Give it a lower number the meter will have more fill.

This meter changes the color of the plant leaves as water depletes. 100% - 60% green leaves = plant is watered, 60% - 30% brown leaves = plant should be watered soon, 30% - 0% black leaves = plant has no water.
![alt text](https://github.com/chrismilheim/react-sensor-meters/blob/main/components/img/waterPlant.png?raw=true)

```javascript
<WaterPlant
  data={400}
  topEndDataLimit={2000}
  date={"12/24/2024"}
  animate={true}
  neon={""}
  fillColor={"blue"}
  backFillColor={"green"}
  valueColor={"blue"}
  labelColor={"blue"}
  cardColor={"white"}
  dotColor={"teal"}
  hover={true}
  gaugeSize={"medium"}
  labelText={"WaterPlant"}
/>
```

---

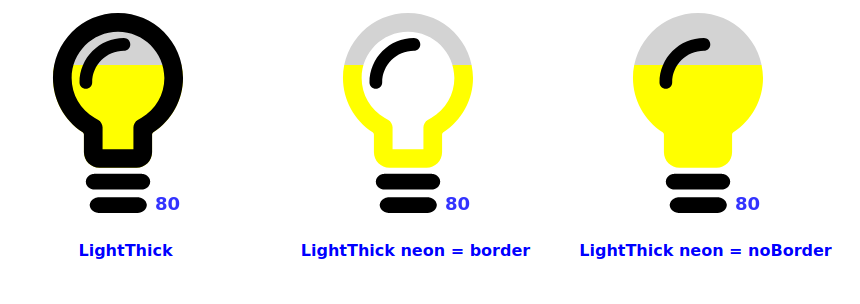
##### LightThick

![alt text](https://github.com/chrismilheim/react-sensor-meters/blob/main/components/img/thickLight.png?raw=true)

```javascript
<LightThick
  data={80}
  topEndDataLimit={120}
  date={"12/24/2024"}
  animate={true}
  neon={""}
  fillColor={" yellow "}
  backFillColor={"lightgrey"}
  valueColor={"blue"}
  labelColor={"blue"}
  cardColor={"white"}
  dotColor={"black"}
  hover={true}
  gaugeSize={"medium"}
  labelText={"LightThick"}
/>
```

---

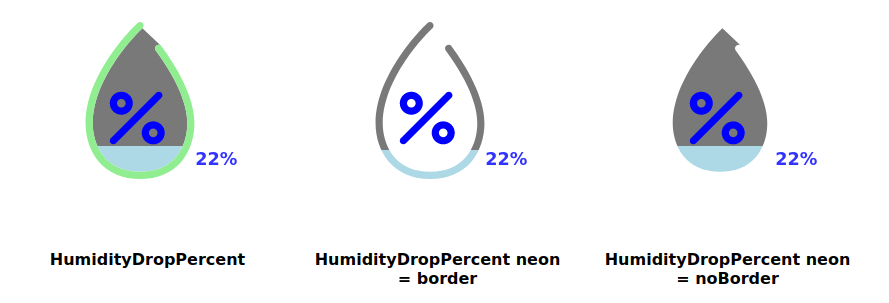
##### HumidityDropPercent

![alt text](https://github.com/chrismilheim/react-sensor-meters/blob/main/components/img/humidityDropPercent.png?raw=true)

```javascript
<HumidityDropPercent
  data={22}
  topEndDataLimit={120}
  date={"12/24/2024"}
  animate={true}
  neon={""}
  fillColor={"lightblue"}
  backFillColor={"rgba(43, 42, 42, 0.627)"}
  valueColor={"blue"}
  labelColor={"black"}
  cardColor={"white"}
  dotColor={"blue"}
  hover={true}
  gaugeSize={"medium"}
  labelText={"HumidityDropPercent "}
  highFillColor={"purple"}
  highFillThreshold={95}
  borderColor={"lightGreen"}
/>
```

---

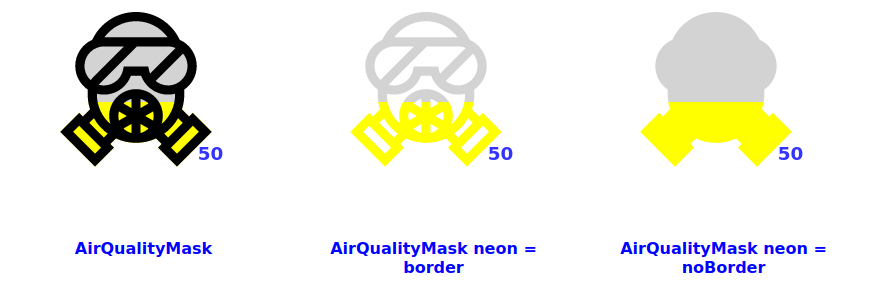
##### AirQualityMask

![alt text](https://github.com/chrismilheim/react-sensor-meters/blob/main/components/img/airQualityMask.png?raw=true)

```javascript
<AirQualityMask
  data={50}
  topEndDataLimit={120}
  date={"12/24/2024"}
  animate={true}
  neon={""}
  fillColor={" yellow "}
  backFillColor={"lightgrey"}
  valueColor={"blue"}
  labelColor={"blue"}
  cardColor={"white"}
  dotColor={"teal"}
  hover={true}
  gaugeSize={"medium"}
  labelText={"AirQualityMask"}
/>
```

---

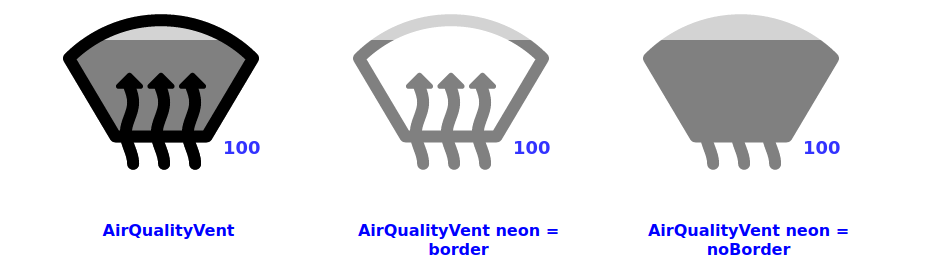
##### AirQualityVent

![alt text](https://github.com/chrismilheim/react-sensor-meters/blob/main/components/img/airQualityVent.png?raw=true)

```javascript
<AirQualityVent
  data={100}
  topEndDataLimit={120}
  date={"12/24/2024"}
  animate={true}
  neon={""}
  fillColor={" grey "}
  backFillColor={"lightgrey"}
  valueColor={"blue"}
  labelColor={"blue"}
  cardColor={"white"}
  dotColor={"teal"}
  hover={true}
  gaugeSize={"medium"}
  labelText={"AirQualityVent"}
/>
```

---

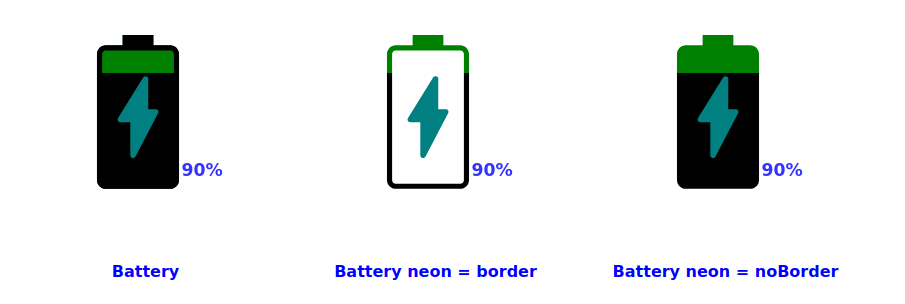
##### Battery

![alt text](https://github.com/chrismilheim/react-sensor-meters/blob/main/components/img/battery.png?raw=true)

```javascript
<Battery
  data={90}
  topEndDataLimit={120}
  date={"12/24/2024"}
  animate={true}
  neon={""}
  fillColor={"lightgreen"}
  backFillColor={"green"}
  valueColor={"blue"}
  labelColor={"blue"}
  cardColor={"white"}
  dotColor={"teal"}
  hover={true}
  gaugeSize={"medium"}
  labelText={"Battery "}
  highFillThreshold={80}
/>
```

---

##### CarBattery

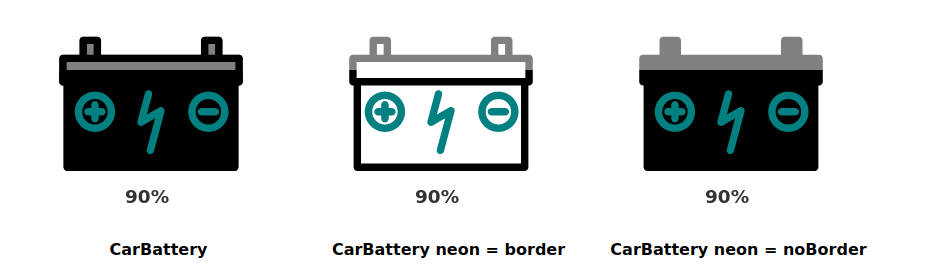
![alt text](https://github.com/chrismilheim/react-sensor-meters/blob/main/components/img/carbattery.png?raw=true)

```javascript
<CarBattery
  data={90}
  topEndDataLimit={120}
  date={"12/24/2024"}
  animate={true}
  neon={""}
  fillColor={"black"}
  backFillColor={"grey"}
  valueColor={"black"}
  labelColor={"black"}
  cardColor={"white"}
  dotColor={"teal"}
  hover={true}
  gaugeSize={"medium"}
  labelText={"CarBattery"}
  highFillThreshold={80}
/>
```

---

##### BasicCircle

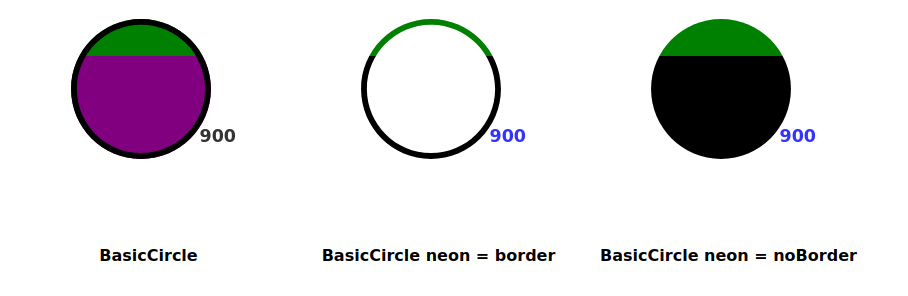
![alt text](https://github.com/chrismilheim/react-sensor-meters/blob/main/components/img/basicCircle.png?raw=true)

```javascript
<BasicCircle
  data={900}
  topEndDataLimit={1220}
  date={"12/24/2024"}
  animate={true}
  neon={""}
  fillColor={"lightgreen"}
  backFillColor={"green"}
  valueColor={"black"}
  labelColor={"black"}
  cardColor={"white"}
  dotColor={"teal"}
  hover={true}
  gaugeSize={"medium"}
  labelText={"BasicCircle"}
  highFillColor={"purple"}
  highFillThreshold={80}
/>
```

---

##### BasicRectangle

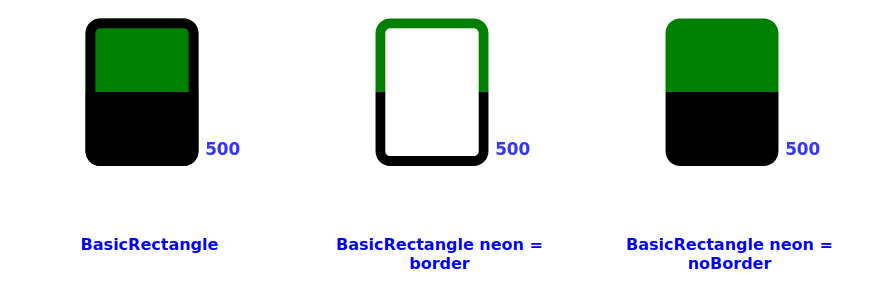
![alt text](https://github.com/chrismilheim/react-sensor-meters/blob/main/components/img/basicRectangle.png?raw=true)

```javascript
<BasicRectangle
  data={500}
  topEndDataLimit={1000}
  date={"12/24/2024"}
  animate={true}
  neon={""}
  fillColor={"lightgreen"}
  backFillColor={"green"}
  valueColor={"blue"}
  labelColor={"blue"}
  cardColor={"white"}
  dotColor={"teal"}
  hover={true}
  gaugeSize={"medium"}
  labelText={"BasicRectangle"}
  highFillThreshold={80}
/>
```

##### Build NPM Package

From the root folder run:

`npm run build-lib`

---
_Source: https://npm.io/package/react-sensor-meters · Machine-readable twin of the npm.io package page. Health data is recomputed on every publish._