# triangled-spider-chart
> A Vue.js component that display a triangled style spider chart.
Latest version **0.1.4-b** (published 2020-06-30) · MIT license · 0 weekly downloads
## Install
```sh
npm install triangled-spider-chart
pnpm add triangled-spider-chart
yarn add triangled-spider-chart
bun add triangled-spider-chart
```
## Health
**Score 15/100 (F)** — status: abandoned.
Positive: no vulnerabilities.
Warnings: low downloads; no types; no esm support; pre 1.0.
Negative: abandoned; low maintenance score.
## Facts
| | |
|---|---|
| Version | 0.1.4-b |
| Published | 2020-06-30 |
| First published | 2020-06-14 |
| Weekly downloads | 0 |
| License | MIT |
| TypeScript types | none |
| Module format | CommonJS |
| Dependencies | 3 |
| Unpacked size | 837.8 KB |
| Known vulnerabilities | 0 (+1 in 1 direct dependencies) |
| Install scripts | no |
| GitHub stars | 1 |
| Author | DPro Asia |
| Maintainers | dproasia |
| Keywords | spider, chart, triangle, vue-chart, spider-chart, triangled-chart |
## Links
- npm: https://www.npmjs.com/package/triangled-spider-chart
- Repository: https://github.com/dproasia/triangled-spider-chart
- Homepage: https://github.com/dproasia/triangled-spider-chart#readme
- Issues: https://github.com/dproasia/triangled-spider-chart/issues
- npm.io page: https://npm.io/package/triangled-spider-chart
## Dependencies (3)
- [vue](https://npm.io/package/vue.md) ^2.6.11
- [core-js](https://npm.io/package/core-js.md) ^3.6.5
- [numeral](https://npm.io/package/numeral.md) ^2.0.6
## Alternatives
- [d3-force-3d](https://npm.io/package/d3-force-3d.md) — 1.0M weekly downloads
- [ng2-charts](https://npm.io/package/ng2-charts.md) — 486.8K weekly downloads
- [@arcgis/core](https://npm.io/package/@arcgis/core.md) — 257.8K weekly downloads
- [react-sparklines](https://npm.io/package/react-sparklines.md) — 249.3K weekly downloads
- [react-native-gifted-charts](https://npm.io/package/react-native-gifted-charts.md) — 182.3K weekly downloads
## Recent versions
- 0.1.4-b (latest) — 2020-06-30
- 0.1.4-a — 2020-06-30
- 0.1.4 — 2020-06-30
- 0.1.3 — 2020-06-15
- 0.1.2 — 2020-06-14
- 0.1.1 — 2020-06-14
## README
# Vue.js Triangled Spider Chart
A Vue.js component that displays a triangled style spider chart.
## Simple setup
```
npm install triangled-spider-chart
```
## Simple usage
In the script
```
import TriangledSpiderChart from "triangled-spider-chart";
export default {
...
components: {
TriangledSpiderChart
},
data() {
return {
chartData: [5, 10, 15, 20, 25, 30, 35]
}
}
}
```
In the template
```
```
### Customize configuration
#### Properties
- **size**: *Number* Dimension (for both width and height) of the chart. Default is 300.
- **max**: *Number* Maximum value to display within the chart. Maximum value of **chartData** if omitted.
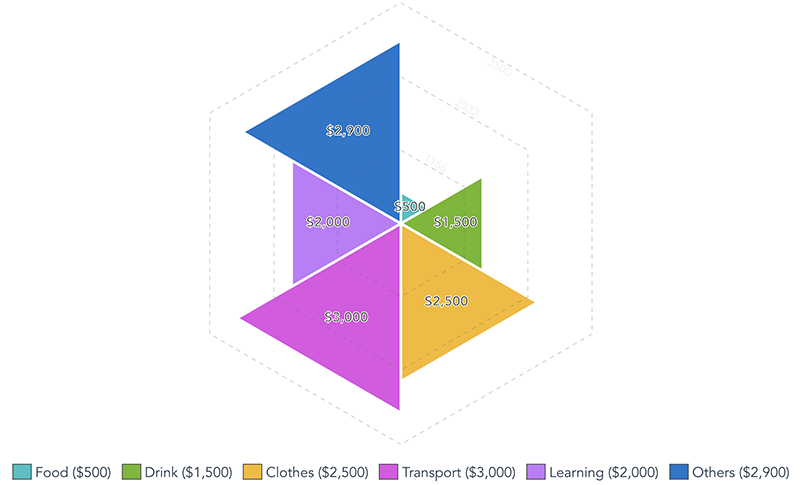
- **chartData**: *Array|required* Chart series data. Data can be numbers only, ex: [5, 10, 15, 20, 25, 30, 35]. Or can define as array of Object with value and label, ex: chartData: [{ value: 500, label: 'Food', fill: '#25C1C3', hover: '#25C1C3BF' }, { value: 1500, label: 'Drink' }, ...].
- **chartLabelData** *Array* Chart series label.
- **selectedIndex**: *Number* Default selected (highlighted) item index.
- **options** *Object* Custom styling for the chart.
##### The options definition
- **strokeWidth**: *Number* Size of the chart serie stroke. Default is 3.
- **strokeColor**: *Number* Color fo the chart serie stroke. Default is White.
- **fills** *String|Array* Fill colors of chart series. Ramdomize colors if omitted.
- **hoverFills** *String|Array* Fill colors of chart series when mouse over. Opacity to 75% if omitted.
- **tooltip** *String* Display tooltip format. Use parameter ${label} and ${value} for data binding.
- **showLegends** *Boolean* Show or hide legends. Default is *false*.
- **showGuideLines** *Boolean* Show or hide guide lines. Default is *false*.
- **guideColor** *String* Guide line color. Default is *#656565*.
- **showValues** *Boolean* Show or hide data value. Default is *false*.
- **valueColor** *String* Color of the data value. Default is *#000000*.
- **valueStroke** *String* Stroke color of the data value. Default is *#FFFFFF*.
- **numberFormat** *String* Number formatting fo the data value. Refer to [Numeraljs](http://numeraljs.com/#format).
### Events
- **onItemMouseOver(index)**: Event emitted when move mouse over an item.
- **onItemMouseOut(index)**: Evet emitted when move mouse out of an item.
- **onItemClick(index)**: Event emitted when click on an item.
## Full options example
In the script
```
import TriangledSpiderChart from "triangled-spider-chart";
export default {
...
components: {
TriangledSpiderChart
},
data() {
return {
chartSize: 500,
chartMax: 3500,
chartData: [
{ value: 500, label: 'Food', fill: '#25C1C3', hover: '#25C1C3BF'},
{ value: 1500, label: 'Drink' },
{ value: 2500, label: 'Clothes' },
{ value: 3000, label: 'Transport' },
{ value: 2000, label: 'Learning' },
{ value: 2900, label: 'Others' }
],
chartOptions: {
strokeWidth: 3,
strokeColor: '#FFFFFF',
fills: ['#FF0000', '#6CB91A', '#F7BA1B', '#E24CE5', '#C378FB', '#1674CD'],
hoverFills: ['#FF0000', '#6CB91ABF', '#F7BA1BBF', '#E24CE5BF', '#C378FBBF', '#1674CDBF'],
tooltip: '${label}: ${value}k',
showLegends: true,
showGuideLines: true,
guideColor: '#656565',
showValues: true,
valueColor: '#000',
valueStroke: '#FFF',
numberFormat: '$0,0'
}
}
}
}
```
In the template
```
```
#### Result

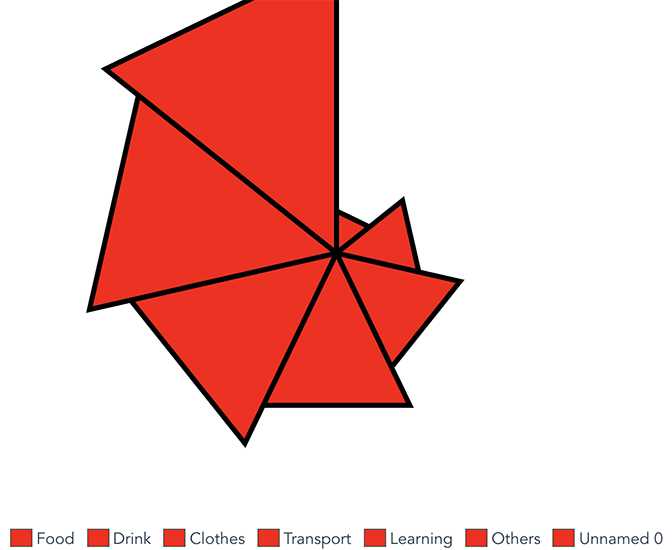
## Full options example (1 fill color)
In the script
```
import TriangledSpiderChart from "triangled-spider-chart";
export default {
...
components: {
TriangledSpiderChart
},
data() {
return {
chartSize: 500,
chartMax: 30,
chartData: [5, 10, 15, 20, 25, 30, 35],
chartLabelData: ['Food', 'Drink', 'Clothes', 'Transport', 'Learning', 'Others'],
chartOptions: {
strokeWidth: 5,
strokeColor: '#000000',
fills: '#ff0000', // all series will be fill Red.
hoverFills: '#00ff00', // all series will be fill Green when mouse over.
showLegends: true
}
}
}
}
```
In the template
```
```
#### Result
---
_Source: https://npm.io/package/triangled-spider-chart · Machine-readable twin of the npm.io package page. Health data is recomputed on every publish._