# vuevertbars
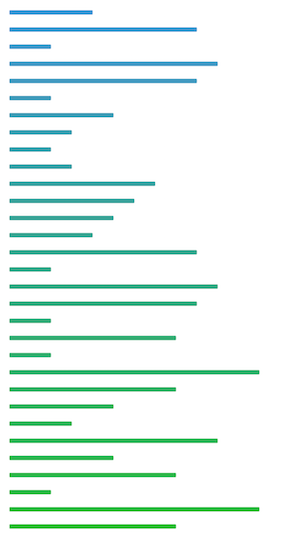
> Simple, vertical spark bars for Vue.js
Latest version **0.3.0** (published 2019-01-06) · MIT license · 0 weekly downloads
## Install
```sh
npm install vuevertbars
pnpm add vuevertbars
yarn add vuevertbars
bun add vuevertbars
```
## Health
**Score 20/100 (F)** — status: abandoned.
Positive: esm support; no vulnerabilities.
Warnings: low downloads; no types; pre 1.0.
Negative: abandoned; low maintenance score.
## Facts
| | |
|---|---|
| Version | 0.3.0 |
| Published | 2019-01-06 |
| First published | 2018-12-22 |
| Weekly downloads | 0 |
| License | MIT |
| TypeScript types | none |
| Module format | ESM + CommonJS |
| Dependencies | 0 |
| Unpacked size | 31 KB |
| Known vulnerabilities | 0 |
| Install scripts | no |
| GitHub stars | 1 |
| Author | Greg Olsen |
| Maintainers | grolsen |
| Keywords | vue, bars, vertical, verticalbars, svg, graph, data-visualization, component |
## Links
- npm: https://www.npmjs.com/package/vuevertbars
- Repository: https://github.com/mhyrr/vue-vert-bar
- Homepage: https://github.com/mhyrr/vue-vert-bar#readme
- Issues: https://github.com/mhyrr/vue-vert-bar/issues
- npm.io page: https://npm.io/package/vuevertbars
## Alternatives
- [d3-force-3d](https://npm.io/package/d3-force-3d.md) — 1.0M weekly downloads
- [ng2-charts](https://npm.io/package/ng2-charts.md) — 486.8K weekly downloads
- [@arcgis/core](https://npm.io/package/@arcgis/core.md) — 257.8K weekly downloads
- [react-sparklines](https://npm.io/package/react-sparklines.md) — 249.3K weekly downloads
- [react-native-gifted-charts](https://npm.io/package/react-native-gifted-charts.md) — 182.3K weekly downloads
## Recent versions
- 0.3.0 (latest) — 2019-01-06
- 0.2.0 — 2019-01-06
- 0.1.0 — 2018-12-22
## README
## Installation
```shell
npm i vuebars -S
```
## Usage
```js
import Vue from 'vue'
import Bars from 'vuevertbars'
Vue.use(Bars)
```
[Live Demo](https://mhyrr.github.io/vue-vert-bar/index.html)
*vue template*
```vue
```
## Inspired by
- [vuebars](https://github.com/DeviaVir/vue-bar) - 🌈 Simple, elegant spark bars for Vue.js
- [vuetrend](https://www.npmjs.org/package/vuetrend) - 📈 Simple, elegant spark lines
## API
#### SVG Props
By default, all properties not recognized by Vue Bars will be delegated to the SVG. The line inherits these properties if none of its own override them.
Additionally you can use the following properties to customize your bar graph further:
```
- rounding // specify how round your bars should be
- barHeight // specify how tall your bars should be
```
#### `data`
| Type | Required | Default |
|-----------------|----------|-------------|
| [Number\|Object] | ✓ | `undefined` |
The data accepted by Vue Bars is incredibly simple: An array of y-axis values to graph.
Vue Bars takes care of normalization, so don't worry about ensuring the data is in a specific range.
This does mean that all data points will be evenly-spaced. If you have irregularly-spaced data, it will not be properly represented.
As of v1.2.0, you may supply an array of data objects with a `value` property.
###### Example
```vue
```
#### `gradient`
| Type | Required | Default |
|----------|----------|-------------|
| [String] | ✕ | `undefined` |
Vue Barssupports vertical gradients. It accepts an array of 2 colour values, and will fade evenly between them from left to right.
Colour should be specified as a full HEX value.
###### Example
```vue
```
#### `height`
| Type | Required | Default |
|----------|----------|-------------|
| Number | ✕ | `undefined` |
Set an explicit height for your SVG. By default it ensures a 1:4 aspect ratio with the width, and the width expands to fill the container.
Note that in _most_ cases it is sufficient to leave this blank, and just control the size of the parent container.
###### Example
```vue
```
#### `padding`
| Type | Required | Default |
|----------|----------|-------------|
| Number | ✕ | `8` |
If you set a very large `strokeWidth` on your line, you may notice that it gets "cropped" towards the edges. This is because SVGs don't support overflow.
By increasing this number, you expand the space around the line, so that very thick lines aren't cropped.
In most cases you don't need to touch this value.
###### Example
```vue
```
#### `width`
| Type | Required | Default |
|----------|----------|-------------|
| Number | ✕ | `undefined` |
Set an explicit width for your SVG. By default it ensures a 1:4 aspect ratio with the height, expanding to fill the width of the container.
Note that in _most_ cases it is sufficient to leave this blank, and just control the width of the parent container.
###### Example
```vue
```
## Labels
You can pass an array of objects as data value, and give your labels a `title`. On hover, the label will be displayed.
```vue
```
## On-the-fly reloading
Make sure you use pass the same variable for your `data` as for the `key`, this will make sure Vue recognizes changes to your data array,
and consequently forces a reload of the instance.
## TODO
- Unit test
## License
MIT
---
_Source: https://npm.io/package/vuevertbars · Machine-readable twin of the npm.io package page. Health data is recomputed on every publish._