# webcharts
> A library for creating flexible, interactive charts
Latest version **1.11.6** (published 2019-06-13) · MIT license · 0 weekly downloads
## Install
```sh
npm install webcharts
pnpm add webcharts
yarn add webcharts
bun add webcharts
```
## Health
**Score 20/100 (F)** — status: abandoned.
Positive: esm support; no vulnerabilities.
Warnings: low downloads; no types.
Negative: abandoned; low maintenance score.
## Facts
| | |
|---|---|
| Version | 1.11.6 |
| Published | 2019-06-13 |
| First published | 2015-10-30 |
| Weekly downloads | 0 |
| License | MIT |
| TypeScript types | none |
| Module format | ESM + CommonJS |
| Dependencies | 2 |
| Unpacked size | 2 MB |
| Known vulnerabilities | 0 |
| Install scripts | no |
| GitHub stars | 36 |
| Author | Rho, Inc. |
| Maintainers | jwildfire, pburnsdata, rhographics, samussiah |
| Keywords | charts, javascript, interactive, data visualization |
## Links
- npm: https://www.npmjs.com/package/webcharts
- Repository: https://github.com/rhoinc/webcharts
- Homepage: https://github.com/RhoInc/Webcharts
- Issues: https://github.com/rhoinc/webcharts/issues
- npm.io page: https://npm.io/package/webcharts
## Dependencies (2)
- [d3](https://npm.io/package/d3.md) ^3
- [js-xlsx](https://npm.io/package/js-xlsx.md) ^0.8.22
## Alternatives
- [d3-force-3d](https://npm.io/package/d3-force-3d.md) — 1.0M weekly downloads
- [ng2-charts](https://npm.io/package/ng2-charts.md) — 486.8K weekly downloads
- [@arcgis/core](https://npm.io/package/@arcgis/core.md) — 257.8K weekly downloads
- [react-sparklines](https://npm.io/package/react-sparklines.md) — 249.3K weekly downloads
- [react-native-gifted-charts](https://npm.io/package/react-native-gifted-charts.md) — 182.3K weekly downloads
## Recent versions
- 1.11.6 (latest) — 2019-06-13
- 1.11.5 — 2019-03-28
- 1.11.4 — 2019-03-27
- 1.11.3 — 2019-03-11
- 1.11.2 — 2018-12-18
- 1.11.1 — 2018-10-05
- 1.11.0 — 2018-09-04
- 1.10.0 — 2018-03-09
- 1.9.1 — 2018-01-05
- 1.9.0 — 2017-10-16
- 1.8.2 — 2017-08-23
- 1.8.1 — 2017-08-16
- 1.8.0 — 2017-06-29
- 1.7.1 — 2017-02-17
- 1.7.0 — 2016-12-21
- … 10 more at https://npm.io/package/webcharts/versions
## README
[](https://zenodo.org/badge/latestdoi/21330/RhoInc/Webcharts) [](https://travis-ci.org/RhoInc/Webcharts)
# Overview
Webcharts is a charting library built on top of [D3.js](https://github.com/mbostock/d3) that offers a simple way to create reusable, flexible, interactive charts with JavaScript. Charts can be customized with a handful of settings and extended through callback functions. Webcharts can also create sets of controls that are tied to charts to dynamically manipulate chart data, appearance, or behavior.
For a detailed description of the framework, see the [Webcharts - A Web-based Charting Library for Custom Interactive Data Visualization](http://openresearchsoftware.metajnl.com/articles/10.5334/jors.127/) in the [Journal of Open Research Software](http://openresearchsoftware.metajnl.com/). Full API documentation is in the [wiki](https://github.com/RhoInc/Webcharts).
# How to Use
Webcharts can be used in modern browsers (Chrome, Firefox, IE9+, etc.) and also exports itself as a CommonJS module for compatibility with Node. Install the package via npm:
```bash
npm install --save webcharts
```
Then, use it in your modules:
```javascript
var webCharts = require('webcharts');
// or, in ES6:
import webCharts from 'webcharts';
```
To use Webcharts in the browser, just make sure to include a reference to D3 first:
```html
```
Webcharts can also be used with an AMD module loader like [Require.js](http://requirejs.org/):
```javascript
require.config({
paths: {
webCharts: 'webcharts'
}
});
require(['webCharts'], function(webCharts) {
console.log(webCharts.version);
// make some charts!
});
```
# Making a Chart
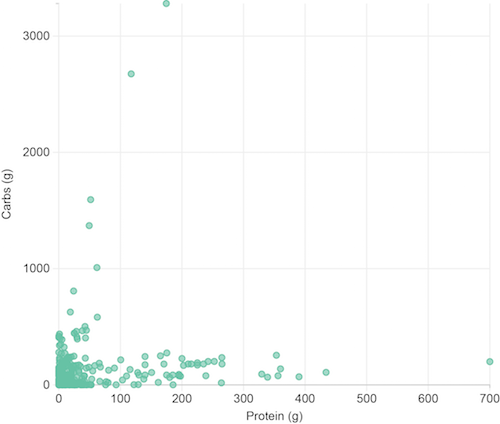
A chart is created with a call to [webCharts.createChart](https://github.com/RhoInc/Webcharts/wiki/Webcharts-API#webchartscreatechartelement-config-controls), a function that takes a few arguments and returns an object that represents a chart:
```javascript
// define a configuration object
var settings = {
max_width: 500,
x: {
label: 'Protein (g)',
type: 'linear',
column: 'Protein (g)'
},
y: {
label: 'Carbs (g)',
type: 'linear',
column: 'Carbo(g)'
},
marks: [
{
type: 'circle',
per: ['Food'],
tooltip: '[Food]'
}
],
aspect: 1.0,
gridlines:' xy'
};
// create the chart using the configuration above
// the chart will be rendered in the element
var myChart = webCharts.createChart('body', settings);
// pass some data to the chart's init() method
// d3.csv is used to load data from a csv
d3.csv('/path/to/calories.csv', function(error,csv) {
myChart.init(csv);
});
```
The first argument, `'body'`, tells the function where to draw the chart. This is a simple CSS selector, so it may reference a DOM element name (like in this example) or target and id or class attribute, like `'.chart-wrapper'`.
The second argument is a configuration object that sets a number of options for the chart. The config object in this example sets some basic options like what dataset fields should be mapped to the `x` and `y` axes, what type of `marks` should be drawn, how wide the chart can get (`max_width`), its `aspect` ratio, and where `gridlines` should be drawn. All of the possible configuration options are described [here](https://github.com/RhoInc/Webcharts/wiki/Chart-Configuration).
The chart object returned by [webCharts.createChart](https://github.com/RhoInc/Webcharts/wiki/Webcharts-API#webchartscreatechartelement-config-controls) can then be initialized by passing data to the chart via its `init()` method. This method is the first in a chain of [a set of lifecycle methods](https://github.com/RhoInc/Webcharts/wiki/Webcharts-Life-Cycle) which create necessary DOM elements, define internal charting variables, manipulate data, and then render the chart via SVG.
Behold! The code above will produce a chart like this:
To see the real thing and look more closely at the code, [check out this gist](http://bl.ocks.org/nbryant/aeaf8d734d7600ca3afa).
# More Information
[API documentation](https://github.com/RhoInc/Webcharts/wiki/Webcharts-API)
[Manuscript](http://openresearchsoftware.metajnl.com/articles/10.5334/jors.127/)
[Examples](https://github.com/RhoInc/Webcharts/wiki/Examples)
---
_Source: https://npm.io/package/webcharts · Machine-readable twin of the npm.io package page. Health data is recomputed on every publish._