# xlsx-chart
> MS Excel Charts
Latest version **0.4.3** (published 2021-06-04) · MIT license · 0 weekly downloads
## Install
```sh
npm install xlsx-chart
pnpm add xlsx-chart
yarn add xlsx-chart
bun add xlsx-chart
```
## Health
**Score 15/100 (F)** — status: abandoned.
Positive: no vulnerabilities.
Warnings: low downloads; no types; no esm support; pre 1.0.
Negative: abandoned; low maintenance score.
## Facts
| | |
|---|---|
| Version | 0.4.3 |
| Published | 2021-06-04 |
| First published | 2015-10-22 |
| Weekly downloads | 0 |
| License | MIT |
| TypeScript types | none |
| Module format | CommonJS |
| Dependencies | 6 |
| Unpacked size | 433.1 KB |
| Known vulnerabilities | 0 (+2 in 2 direct dependencies) |
| Install scripts | no |
| Author | Dmitriy Samortsev |
| Maintainers | objectum |
| Keywords | excel, xlsx, chart |
## Links
- npm: https://www.npmjs.com/package/xlsx-chart
- Repository: https://github.com/objectum/xlsx-chart
- Homepage: https://github.com/objectum/xlsx-chart#readme
- Issues: https://github.com/objectum/xlsx-chart/issues
- npm.io page: https://npm.io/package/xlsx-chart
## Dependencies (6)
- [async](https://npm.io/package/async.md) ^1.4.2
- [jszip](https://npm.io/package/jszip.md) ^2.5.0
- [verror](https://npm.io/package/verror.md) ^1.6.0
- [xml2js](https://npm.io/package/xml2js.md) ^0.4.13
- [backbone](https://npm.io/package/backbone.md) ^1.2.3
- [underscore](https://npm.io/package/underscore.md) ^1.8.3
## Alternatives
- [d3-force-3d](https://npm.io/package/d3-force-3d.md) — 1.0M weekly downloads
- [ng2-charts](https://npm.io/package/ng2-charts.md) — 486.8K weekly downloads
- [@arcgis/core](https://npm.io/package/@arcgis/core.md) — 257.8K weekly downloads
- [react-sparklines](https://npm.io/package/react-sparklines.md) — 249.3K weekly downloads
- [react-native-gifted-charts](https://npm.io/package/react-native-gifted-charts.md) — 182.3K weekly downloads
## Recent versions
- 0.4.3 (latest) — 2021-06-04
- 0.4.2 — 2020-10-29
- 0.4.1 — 2020-10-27
- 0.4.0 — 2020-10-27
- 0.3.9 — 2020-10-26
- 0.3.8 — 2019-09-04
- 0.3.7 — 2019-09-04
- 0.3.6 — 2019-09-04
- 0.3.5 — 2019-09-04
- 0.3.4 — 2019-09-04
- 0.3.3 — 2019-08-30
- 0.3.2 — 2019-08-30
- 0.3.1 — 2019-08-30
- 0.3.0 — 2017-03-05
- 0.2.4 — 2016-11-10
- … 7 more at https://npm.io/package/xlsx-chart/versions
## README
# xlsx-chart
Node.js excel chart builder
## Quick start
Install
```bash
npm install xlsx-chart
```
Generate and write chart to file
```js
var XLSXChart = require ("xlsx-chart");
var xlsxChart = new XLSXChart ();
var opts = {
file: "chart.xlsx",
chart: "column",
titles: [
"Title 1",
"Title 2",
"Title 3"
],
fields: [
"Field 1",
"Field 2",
"Field 3",
"Field 4"
],
data: {
"Title 1": {
"Field 1": 5,
"Field 2": 10,
"Field 3": 15,
"Field 4": 20
},
"Title 2": {
"Field 1": 10,
"Field 2": 5,
"Field 3": 20,
"Field 4": 15
},
"Title 3": {
"Field 1": 20,
"Field 2": 15,
"Field 3": 10,
"Field 4": 5
}
}
};
xlsxChart.writeFile (opts, function (err) {
console.log ("File: ", opts.file);
});
```
Generate and download chart data
```js
xlsxChart.generate (opts, function (err, data) {
res.set ({
"Content-Type": "application/vnd.ms-excel",
"Content-Disposition": "attachment; filename=chart.xlsx",
"Content-Length": data.length
});
res.status (200).send (data);
});
```
## Chart types
column, bar, line, area, radar, scatter, pie
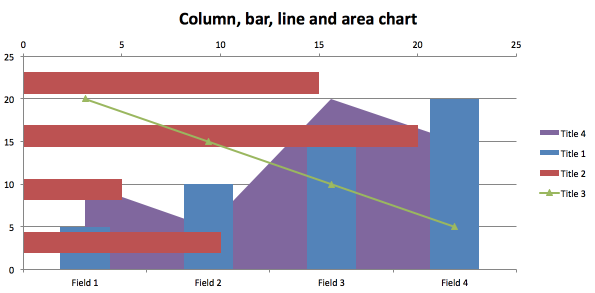
## Mixing
You can mix column, bar, line, area.
## Custom template
Default templates: xlsx-chart/template/*.xlsx
```js
var opts = {
file: "chart.xlsx",
chart: "column",
templatePath: __dirname + "/myColumn.xlsx",
...
};
xlsxChart.writeFile (opts, function (err) {
console.log ("File: ", opts.file);
});
```
## Multiple charts
```js
let fs = require ("fs");
let XLSXChart = require ("xlsx-chart");
let xlsxChart = new XLSXChart ();
let opts = {
charts: [{
chart: "column",
titles: [
"Title 1",
"Title 2",
"Title 3"
],
fields: [
"Field 1",
"Field 2",
"Field 3",
"Field 4"
],
data: {
"Title 1": {
"Field 1": 5,
"Field 2": 10,
"Field 3": 15,
"Field 4": 20
},
"Title 2": {
"Field 1": 10,
"Field 2": 5,
"Field 3": 20,
"Field 4": 15
},
"Title 3": {
"Field 1": 20,
"Field 2": 15,
"Field 3": 10,
"Field 4": 5
}
},
chartTitle: "Title 1"
}, {
chart: "column",
titles: [
"Title 1",
"Title 2",
"Title 3"
],
fields: [
"Field 1",
"Field 2",
"Field 3",
"Field 4"
],
data: {
"Title 1": {
"Field 1": 5,
"Field 2": 10,
"Field 3": 15,
"Field 4": 20
},
"Title 2": {
"Field 1": 10,
"Field 2": 5,
"Field 3": 20,
"Field 4": 15
},
"Title 3": {
"Field 1": 20,
"Field 2": 15,
"Field 3": 10,
"Field 4": 5
}
},
chartTitle: "Title 2"
}, {
chart: "column",
titles: [
"Title 1",
"Title 2",
],
fields: [
"Field 1",
"Field 2",
"Field 3",
],
data: {
"Title 1": {
"Field 1": 15,
"Field 2": 30,
"Field 3": 45,
},
"Title 2": {
"Field 1": 5,
"Field 2": 2,
"Field 3": 10
}
},
chartTitle: "Title 3"
}]
};
xlsxChart.generate (opts, function (err, data) {
fs.writeFileSync ("chart.xlsx", data);
});
```
## Examples
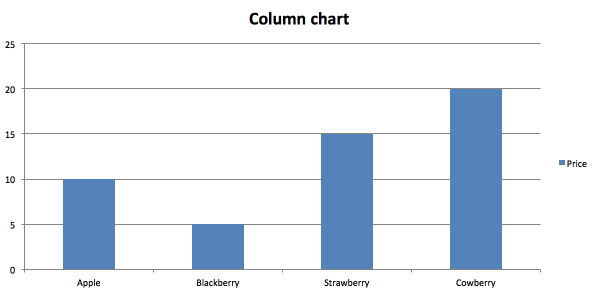
column.js
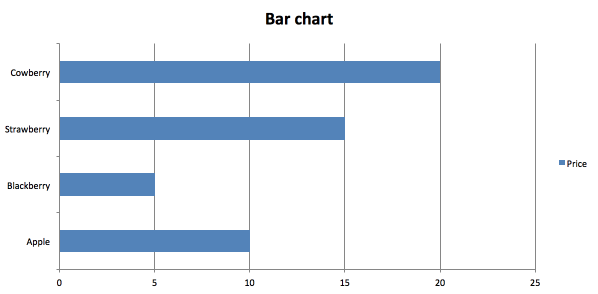
bar.js
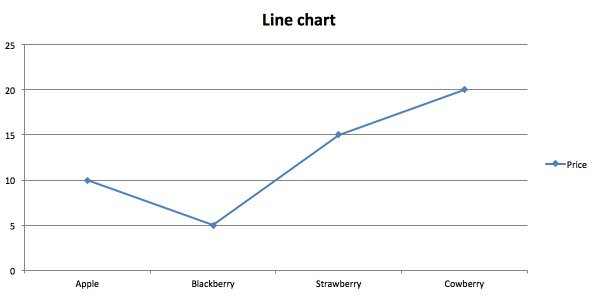
line.js
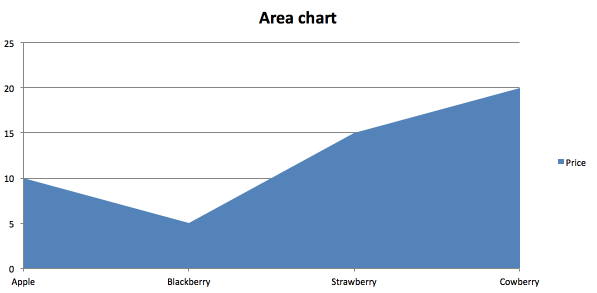
area.js
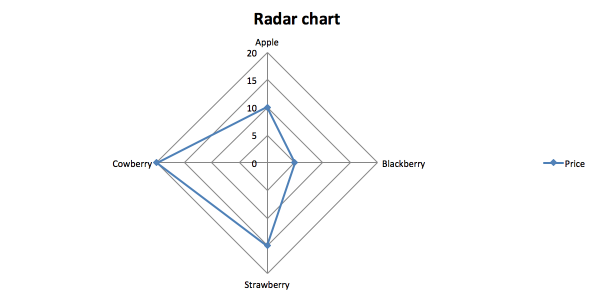
radar.js
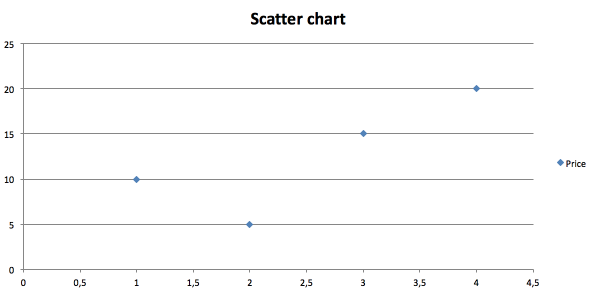
scatter.js
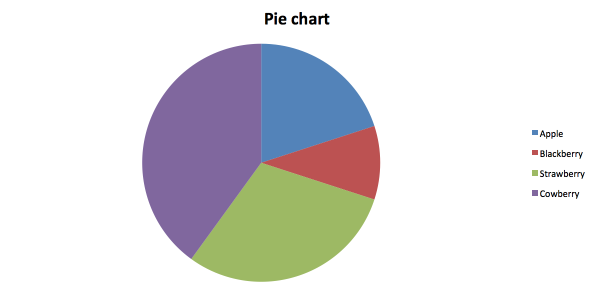
pie.js
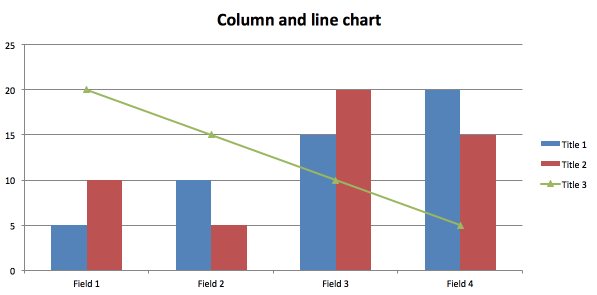
columnLine.js
mix.js
## Author
**Dmitriy Samortsev**
+ http://github.com/objectum
## Copyright and license
MIT
---
_Source: https://npm.io/package/xlsx-chart · Machine-readable twin of the npm.io package page. Health data is recomputed on every publish._