@borderliner/canvas-table v0.1.25
@borderliner/canvas-table
English | 中文
⚡ High-performance canvas table that display mass of data for web. Fork of: x-canvas-table, upgraded to ES module and latest dependencies.
14.7kb gizped, no dependency!
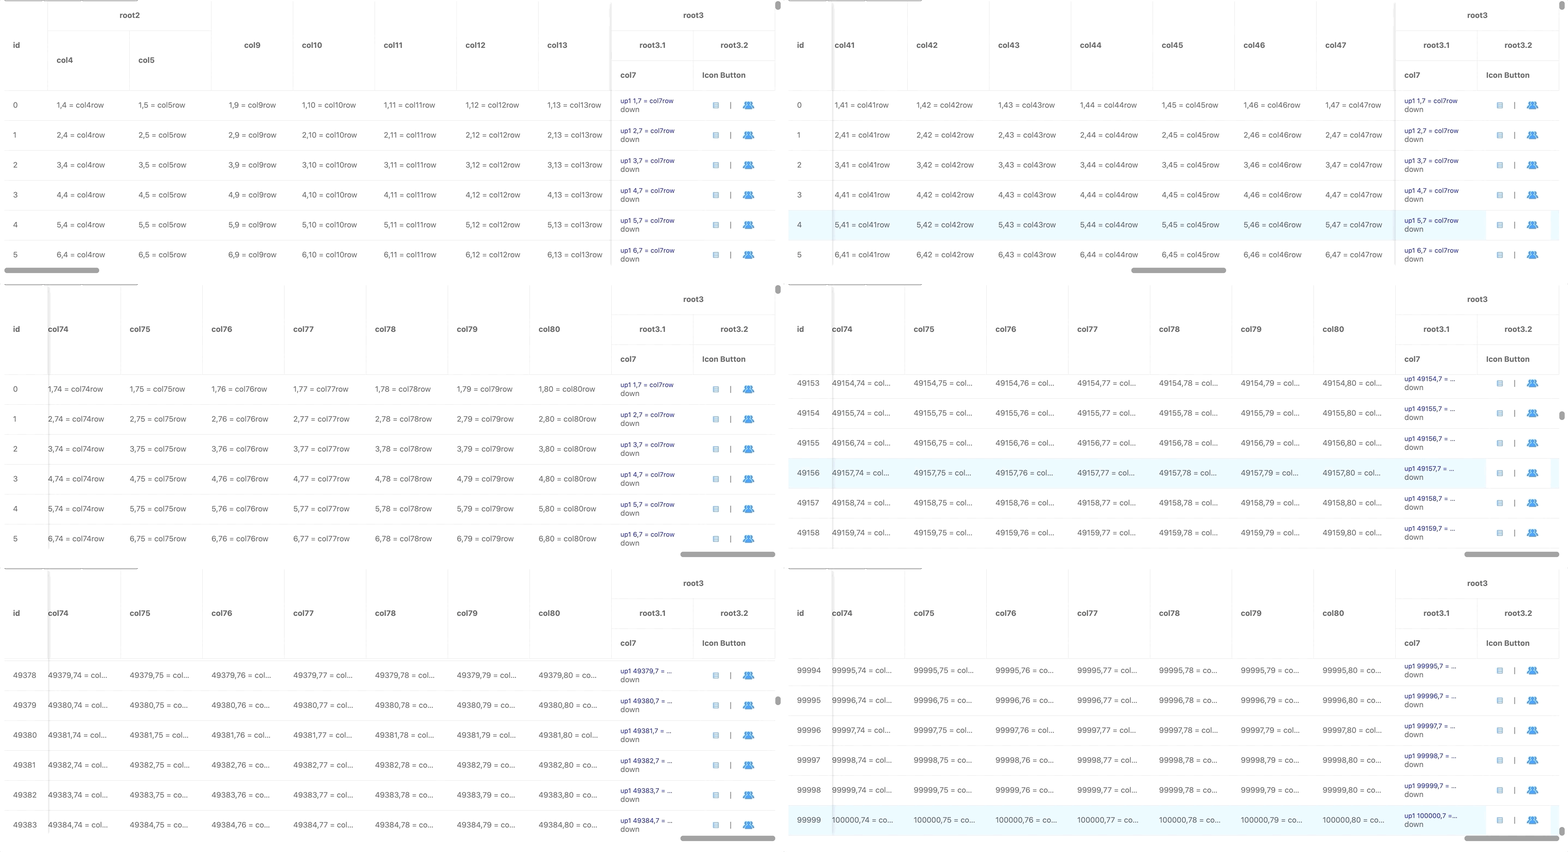
80 columns & 100,000 rows data:

Feature
- High performance works on canvas. 🚀
- Event support, such as click, mouseenter, mouseleave, etc. ✨
- Custom style config. 💄
- Custom icon support. 👍
- Tooltip for every component. 🔎
- Write with typescript. 👔
- You can even create your own component to display! 💖
! it's just like a table implement on dom!
Examples
- basic usage: demo
- display 100000 records: demo
- load remote data with scroll: demo
- fixed header (setting by default, can't change yet)
- fixed columns: demo
- grouping table head: demo
- custom style: demo
- render icon component: demo
Usage
import
- use pnpm
pnpm i @borderliner/canvas-table- use cdn
<script src="https://unpkg.com/@borderliner/canvas-table/umd/canvastable.min.js"></script>basic usage
<div id="canvas-table"></div>import CanvasTable from "@borderliner/canvas-table";
const columns = [
{title: 'avatar', dataIndex: 'avatar'},
{title: 'name',dataIndex: 'name'},
{title: 'age', dataIndex: 'age'},
{title: 'address', dataIndex: 'address'}
]
const dataSource = [
{avatar: '🎅🏻',name: 'chuanJianGuo', age: 74, address: 'America'},
{avatar: '👵🏻', name: 'caiEnglish', age: 63, address: 'China Taiwan'},
{avatar: '-',name: 'trump', age: 74, address: 'America'},
{avatar: '-',name: 'johnson', age: 70, address: 'England'}
]
const ct = new CanvasTable({
container: document.getElementById('canvas-table'),
columns: columns,
style: { height: 500, width: '100%' }
})
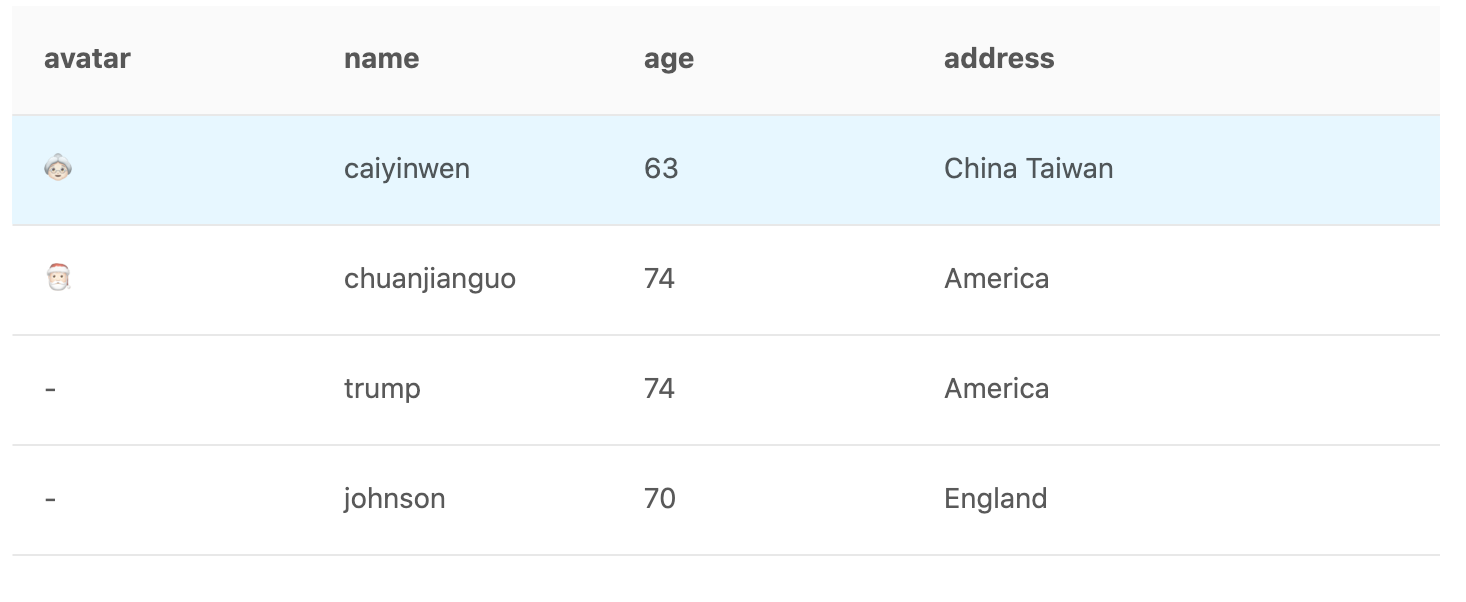
ct.source = dataSource;result:

online demo: click
API
CanvasTable
| Property | Description | Type | Default |
|---|---|---|---|
container | Container element for table | HTMLElement | - |
columns | Columns of table | IColumnProps[] | - |
source | Data record array to be displayed | object[] | - |
style | Style for table | ITableStyleProps | see ITableStyleProps |
onScrollLoad | Callback executed when table scroll to bottom(scrollLoadHeight) | () => Promise<any> | - |
scrollLoadHeight | distance to trigger onScrollLoad | number | 150 |
onRow | Set event props on per row | ITableEventHandler | - |
IColumnProps
One of the Table columns prop for describing the table's columns.
| Property | Description | Type | Default |
|---|---|---|---|
dataIndex | Display field of the data record | object[] | - |
title | Title of this column | string | - |
align | The specify which way that column is aligned | 'left'|'right' | 'center' | 'left' |
popTitle | tooltip for table header cell | string | - |
width | Width of this column | number | 150 |
children | Group table head | IColumn[] | - |
fixed | Set column to be fixed | 'left' | 'right' | - |
render | custom render | (value, record) => string | Layer | - |
onCell | Set event props on per cell | ITableEventHandler | - |
ITableStyleProps
You can custom your table style use this prop
| Property | Description | Type | Default |
|---|---|---|---|
width | width of table | number | string | 100% |
height | height of table | number | string | 100% |
rowHeight | height of each row | number | 55 |
columnWidth | default width of all columns | number | 150 |
borderColor | color of border | string | '#e8e8e8' |
textColor | color of text | string | 'rgba(0,0,0,0.65)' |
fontSize | font size | string | 14px |
fontFamily | font family | string | - |
padding | both left and right padding of table cell | number | 16 |
headerBackColor | background color of header cell | string | '#fafafa' |
headerRowHeight | height of header cell | number | 55 |
onRow usage
Event binding, same as onRow and onCell
interface ITableEventHandler {
    (record: object, rowIndex: number): {
        onClick?: (event) => void,       // onClick Event
        onDoubleClick?: (event) => void, // Double Click
        onContextMenu?: (event) => void, // Right click Event
        onMouseEnter?: (event) => void,  // Mouse Enter
        onMouseLeave?: (event) => void,  // Mouse Leave
    }
}
// Example:
new CanvasTable({
onRow: (record, rowIndex) => {
onClick: () => { alert(`${rowIndex} row clicked`) }
}
})Layer Component
it's the basic component in canvas table. you can think it as a div in HTML,
it usually used on render property of IColumn interface.
you can use it to build a complex component to render.
let's see what we can do.
| Property | Description | Type | Default |
|---|---|---|---|
style | style of layer | ILayerStyleProps | - |
event | event on layer | IEventCollection | - |
popTitle | set title attribute a canvas element | string | - |
children | children of layer | Layer[] | - |
ILayerStyleProps
if you know css, you will know how to use it immediately.
interface ILayerStyleProps {
  top?: number // assume it's top attribute and when position: absolute
  left?: number // assume it's left attribute and when position: absolute
  width?: number | string // number for px, string for percentage of parent
  height?: number | string  // number for px, string for percentage of parent
  padding?: number | number[]  // same as css
  color?: string               // same as css
  backgroundColor?: string;    // same as css
  border?: string | string[]   // same as css
  fontFamily?: string          // same as css
  fontSize?: string            // same as css
  fontWeight?: 'normal' | 'bold'
  zIndex?: number              // same as css
  align?: 'left' | 'center' | 'right'
  overflow?: 'hidden' | 'ellipsis'
}
example creating complex render: demo
the following components is all derived from Layer.
Render A Icon Component
it's provide a Svg Component to support rendering svg file,
How to use?
step 1: import svg file && Svg component
import Home from '@/assets/svg/home.svg'
const { Svg } = CanvasTable
step 2: use render property in columns
const columns = [
  {
    title: 'Action',
    render: () => {
      return new Svg({
        popTitle: 'click me',
        path: Home,
        style: {width: 30, height: 30, color: '#1890ff'},
        event: {
          onClick: () => {alert('button click')}
        }
      })
    }
  }
]
full example: demo
Text Component
| Property | Description | Type | Default |
|---|---|---|---|
text | text to show | string | - |