1.2.0 • Published 2 years ago
@canvasjs/angular-stockcharts
Licence
MIT
Version
1.2.0
Deps
1
Size
91 kB
Vulns
0
Weekly
0
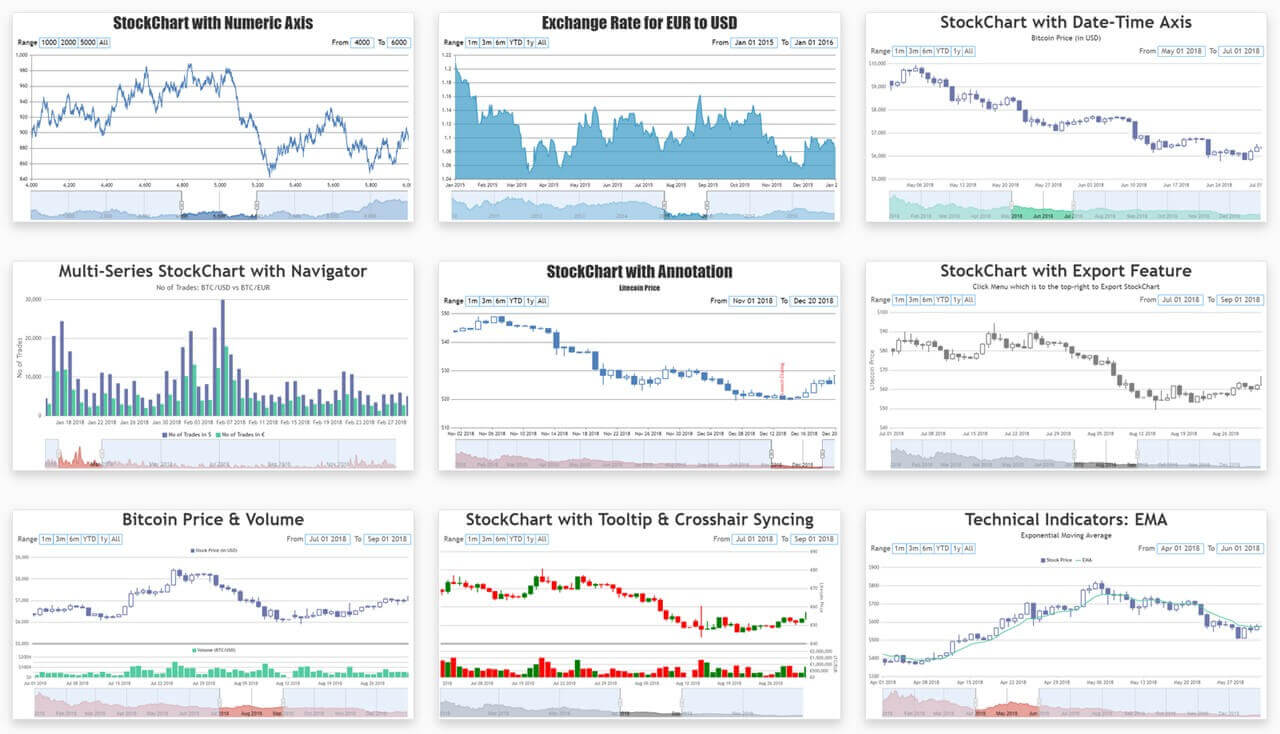
CanvasJS Angular StockCharts - Official
CanvasJS Angular StockChart Component for creating interactive stockchart for your web pages. Library supports a wide range of chart types including line, area, column, candlestick, etc.
Important Links
- Official Website
- Angular StockCharts Demo
- Download CanvasJS
- Angular StockChart Integration
- StockChart Documentation
- StockChart Support Forum
Installing CanvasJS Angular StockCharts
Install CanvasJS StockCharts package to your Angular app
Install Angular StockChart via NPM
npm install @canvasjs/angular-stockchartsSee npm documentation to know more about npm usage.
Import StockChart Module & register it
Import the StockChart module into your Angular application (app.component.ts) & register it.
import { Component } from '@angular/core';
import { CommonModule } from '@angular/common';
import { RouterOutlet } from '@angular/router';
import { CanvasJSAngularStockChartsModule } from '@canvasjs/angular-stockcharts';

@Component({
  selector: 'app-root',
  standalone: true,
  imports: [
    CommonModule,
    RouterOutlet,
    CanvasJSAngularStockChartsModule,
  ],
  templateUrl: './app.component.html',
  styleUrl: './app.component.css'
})
export class AppComponent { }
Set the stockchart-options & create stockchart
Set the stockchart-options in app.component.ts & use ‘canvasjs-stockchart’ selector in app.component.html to create stockchart.
//app.component.ts
import { Component } from '@angular/core';
import { CommonModule } from '@angular/common';
import { RouterOutlet } from '@angular/router';
import { CanvasJSAngularStockChartsModule } from '@canvasjs/angular-stockcharts';

@Component({
  selector: 'app-root',
  standalone: true,
  imports: [
    CommonModule,
    RouterOutlet,
    CanvasJSAngularStockChartsModule,
  ],
  templateUrl: './app.component.html',
  styleUrl: './app.component.css'
})

export class AppComponent {
  stockChartOptions = {
    title: {
      text: "CanvasJS Angular StockChart"
    },
    theme: "light2",
    charts: [{
      data: [{
        type: "line",
        dataPoints: [
          { x: new Date("2018-01-01"), y: 71 },
          { x: new Date("2018-02-01"), y: 55 },
          { x: new Date("2018-03-01"), y: 50 },
          { x: new Date("2018-04-01"), y: 65 },
          { x: new Date("2018-05-01"), y: 95 },
          { x: new Date("2018-06-01"), y: 68 },
          { x: new Date("2018-07-01"), y: 28 },
          { x: new Date("2018-08-01"), y: 34 },
          { x: new Date("2018-09-01"), y: 14 },
          { x: new Date("2018-10-01"), y: 71 },
          { x: new Date("2018-11-01"), y: 55 },
          { x: new Date("2018-12-01"), y: 50 },
          { x: new Date("2019-01-01"), y: 34 },
          { x: new Date("2019-02-01"), y: 50 },
          { x: new Date("2019-03-01"), y: 50 },
          { x: new Date("2019-04-01"), y: 95 },
          { x: new Date("2019-05-01"), y: 68 },
          { x: new Date("2019-06-01"), y: 28 },
          { x: new Date("2019-07-01"), y: 34 },
          { x: new Date("2019-08-01"), y: 65 },
          { x: new Date("2019-09-01"), y: 55 },
          { x: new Date("2019-10-01"), y: 71 },
          { x: new Date("2019-11-01"), y: 55 },
          { x: new Date("2019-12-01"), y: 50 }
        ]
      }]
    }],
    navigator: {
      slider: {
        minimum: new Date("2018-07-01"),
        maximum: new Date("2019-06-30")
      }
    }
  }
}

//app.component.html
<div>
   <canvasjs-stockchart [options]="stockChartOptions"></canvasjs-stockchart>
</div>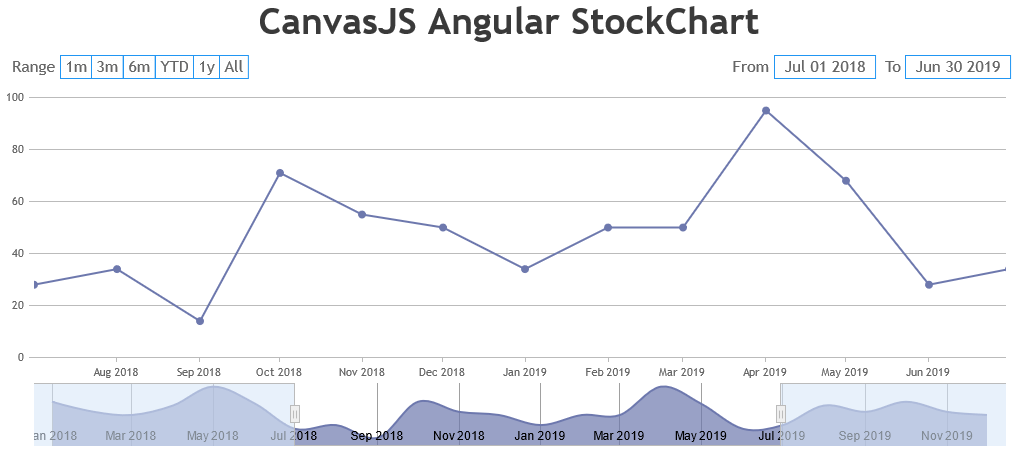
Interactive Angular StockCharts