1.0.2 • Published 2 years ago
@canvasjs/react-stockcharts
Licence
MIT
Version
1.0.2
Deps
0
Size
11 kB
Vulns
0
Weekly
0
CanvasJS React StockCharts - Official
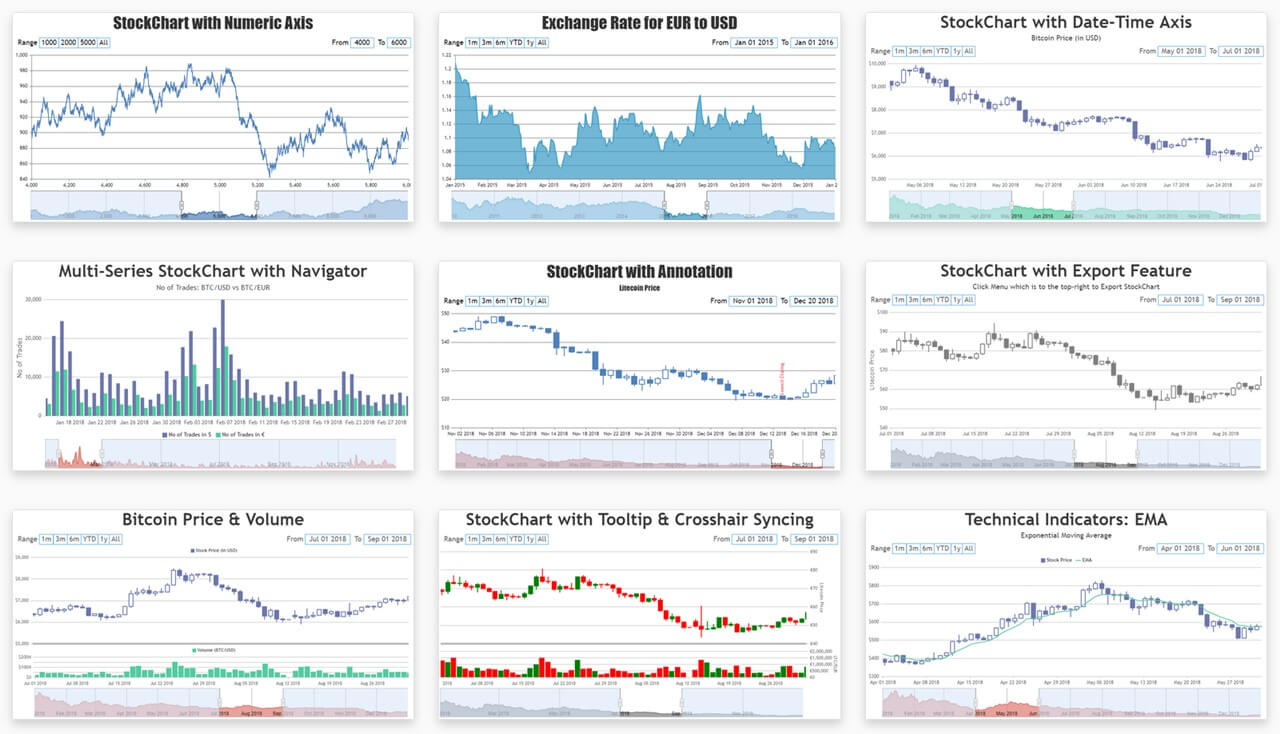
CanvasJS React StockChart Component for creating advanced interactive Financial Charts for your react applications. Library supports a wide range of chart types including line, area, candlestick, ohlc, etc.
Important Links
- Official Website
- React StockCharts Demo
- Download CanvasJS
- React StockCharts Integration
- StockChart Documentation
- StockChart Support Forum
Installing CanvasJS React StockChart
Install CanvasJS React StockCharts to your application from npm.
Install React StockChart via NPM
npm install @canvasjs/react-stockchartsSee npm documentation to know more about npm usage.
Import React StockChart Component
Import the React StockChart module into your React application.
import CanvasJSReact from '@canvasjs/react-stockcharts';
//var CanvasJSReact = require('@canvasjs/react-stockcharts');

var CanvasJSStockChart = CanvasJSReact.CanvasJSStockChart;
Set the stockchart-options & create chart
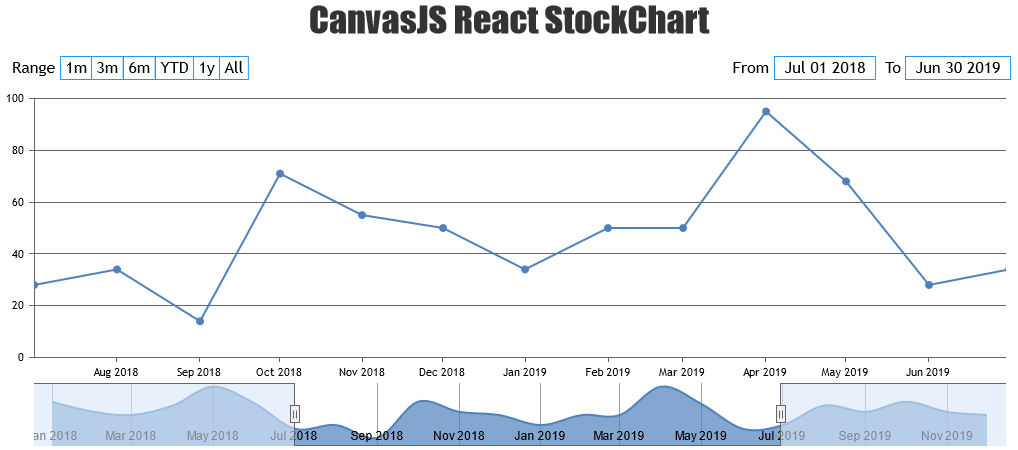
Set the stockchart-options & use 'CanvasJSStockChart' selector to create stockchart.
class App extends Component {
  render() {
    const options = {
      title: {
        text: "CanvasJS React StockChart"
      },
      charts: [{
        data: [{
          type: "line",
          dataPoints: [
            { x: new Date("2018-01-01"), y: 71 },
            { x: new Date("2018-02-01"), y: 55 },
            { x: new Date("2018-03-01"), y: 50 },
            { x: new Date("2018-04-01"), y: 65 },
            { x: new Date("2018-05-01"), y: 95 },
            { x: new Date("2018-06-01"), y: 68 },
            { x: new Date("2018-07-01"), y: 28 },
            { x: new Date("2018-08-01"), y: 34 },
            { x: new Date("2018-09-01"), y: 14 },
            { x: new Date("2018-10-01"), y: 71 },
            { x: new Date("2018-11-01"), y: 55 },
            { x: new Date("2018-12-01"), y: 50 },
            { x: new Date("2019-01-01"), y: 34 },
            { x: new Date("2019-02-01"), y: 50 },
            { x: new Date("2019-03-01"), y: 50 },
            { x: new Date("2019-04-01"), y: 95 },
            { x: new Date("2019-05-01"), y: 68 },
            { x: new Date("2019-06-01"), y: 28 },
            { x: new Date("2019-07-01"), y: 34 },
            { x: new Date("2019-08-01"), y: 65 },
            { x: new Date("2019-09-01"), y: 55 },
            { x: new Date("2019-10-01"), y: 71 },
            { x: new Date("2019-11-01"), y: 55 },
            { x: new Date("2019-12-01"), y: 50 }
          ]
        }]
      }],
      navigator: {
        slider: {
          minimum: new Date("2018-07-01"),
          maximum: new Date("2019-06-30")
        }
      }
    };

    return (
      <div>
        <CanvasJSStockChart options = { options }
          /* onRef = {ref => this.stockchart = ref} */
        />
      </div>
    );
  }
}
Interactive React StockCharts