@christiangalsterer/mongodb-driver-prometheus-exporter v2.2.2
Prometheus Exporter for official MongoDB Node.js driver
A prometheus exporter exposing metrics for the official MongoDB Node.js driver.
Metrics names follow the same naming convention used by micrometer. This allows to use the same metrics in dashboards and alerts across different technology stacks, e.g. when you use Spring Boot and Node.js in different applications.
Available Metrics
The exporter provides the following metrics.
| Metric Name | Description | Labels | Since |
|---|---|---|---|
| mongodb_driver_pool_size | the current size of the connection pool, including idle and in-use members | server_address: URL of the MongoDB Service instance where the driver is connected to | 1.0.0 |
| mongodb_driver_pool_min | the minimum size of the connection pool | server_address: URL of the MongoDB Service instance where the driver is connected to | 1.0.0 |
| mongodb_driver_pool_max | the maximum size of the connection pool | server_address: URL of the MongoDB Service instance where the driver is connected to | 1.0.0 |
| mongodb_driver_pool_checkedout | the count of connections that are currently in use | server_address: URL of the MongoDB Service instance where the driver is connected to | 1.0.0 |
| mongodb_driver_pool_waitqueuesize | the current size of the wait queue for a connection from the pool | server_address: URL of the MongoDB Service instance where the driver is connected to | 1.0.0 |
| mongodb_driver_commands_seconds_sum | Duration of the executed command in seconds | server_address: URL of the MongoDB Service instance where the driver is connected to command: Name if the command status: SUCCESS or ERROR | 1.0.0 |
| mongodb_driver_commands_seconds_count | Number of executed commands | server_address: URL of the MongoDB Service instance where the driver is connected to command: Name if the command status: SUCCESS or ERROR | 1.0.0 |
Example Output
Here an example output in the prometheus format of the provided metrics.
# HELP mongodb_driver_pool_size the current size of the connection pool, including idle and and in-use members
# TYPE mongodb_driver_pool_size gauge
mongodb_driver_pool_size{server_address="127.0.0.1:27017"} 0
mongodb_driver_pool_size{server_address="127.0.0.2:27017"} 0
mongodb_driver_pool_size{server_address="127.0.0.3:27017"} 1

# HELP mongodb_driver_pool_min the minimum size of the connection pool
# TYPE mongodb_driver_pool_min gauge
mongodb_driver_pool_min{server_address="127.0.0.1:27017"} 0
mongodb_driver_pool_min{server_address="127.0.0.2:27017"} 0
mongodb_driver_pool_min{server_address="127.0.0.3:27017"} 0

# HELP mongodb_driver_pool_max the maximum size of the connection pool
# TYPE mongodb_driver_pool_max gauge
mongodb_driver_pool_max{server_address="127.0.0.1:27017"} 100
mongodb_driver_pool_max{server_address="127.0.0.2:27017"} 100
mongodb_driver_pool_max{server_address="127.0.0.3:27017"} 100

# HELP mongodb_driver_pool_checkedout the count of connections that are currently in use
# TYPE mongodb_driver_pool_checkedout gauge
mongodb_driver_pool_checkedout{server_address="127.0.0.1:27017"} 0
mongodb_driver_pool_checkedout{server_address="127.0.0.2:27017"} 0
mongodb_driver_pool_checkedout{server_address="127.0.0.3:27017"} 1

# HELP mongodb_driver_pool_waitqueuesize the current size of the wait queue for a connection from the pool
# TYPE mongodb_driver_pool_waitqueuesize gauge
mongodb_driver_pool_waitqueuesize{server_address="127.0.0.1:27017"} 0
mongodb_driver_pool_waitqueuesize{server_address="127.0.0.2:27017"} 0
mongodb_driver_pool_waitqueuesize{server_address="127.0.0.3:27017"} 0

# HELP mongodb_driver_commands_seconds Timer of mongodb commands
# TYPE mongodb_driver_commands_seconds histogram
mongodb_driver_commands_seconds_bucket{le="0.005",command="ping",server_address="127.0.0.3:27017",status="SUCCESS"} 0
mongodb_driver_commands_seconds_bucket{le="0.01",command="ping",server_address="127.0.0.3:27017",status="SUCCESS"} 0
mongodb_driver_commands_seconds_bucket{le="0.025",command="ping",server_address="127.0.0.3:27017",status="SUCCESS"} 0
mongodb_driver_commands_seconds_bucket{le="0.05",command="ping",server_address="127.0.0.3:27017",status="SUCCESS"} 0
mongodb_driver_commands_seconds_bucket{le="0.1",command="ping",server_address="127.0.0.3:27017",status="SUCCESS"} 0
mongodb_driver_commands_seconds_bucket{le="0.25",command="ping",server_address="127.0.0.3:27017",status="SUCCESS"} 0
mongodb_driver_commands_seconds_bucket{le="0.5",command="ping",server_address="127.0.0.3:27017",status="SUCCESS"} 0
mongodb_driver_commands_seconds_bucket{le="1",command="ping",server_address="127.0.0.3:27017",status="SUCCESS"} 0
mongodb_driver_commands_seconds_bucket{le="2.5",command="ping",server_address="127.0.0.3:27017",status="SUCCESS"} 0
mongodb_driver_commands_seconds_bucket{le="5",command="ping",server_address="127.0.0.3:27017",status="SUCCESS"} 0
mongodb_driver_commands_seconds_bucket{le="10",command="ping",server_address="127.0.0.3:27017",status="SUCCESS"} 0
mongodb_driver_commands_seconds_bucket{le="+Inf",command="ping",server_address="127.0.0.3:27017",status="SUCCESS"} 21
mongodb_driver_commands_seconds_sum{command="ping",server_address="127.0.0.3:27017",status="SUCCESS"} 971000
mongodb_driver_commands_seconds_count{command="ping",server_address="127.0.0.3:27017",status="SUCCESS"} 21
Usage
Add Dependency
Add the following dependency to your project to download the packge from npm.
npm i @christiangalsterer/mongodb-driver-prometheus-exporterTypeScript
The following example illustrates how to use the exporter to enable monitoring for the MongoDB Node.js driver.
import { MongoClient } from "mongodb";
import { Registry, collectDefaultMetrics } from "prom-client";
import { monitorMongoDBDriver } from "@christiangalsterer/mongodb-driver-prometheus-exporter";

...

// set up the MongoDB client, monitorCommands needs to be set to true to enable command monitoring.
const mongoClient = new MongoClient("mongodb", { monitorCommands: true })

// set up the prometheus client
const register = new Registry();
collectDefaultMetrics({ register });

// monitor MongoDB driver
monitorMongoDBDriver(mongoClient, register);

...

// connect to MongoDB after calling monitorMongoDBDriver()
mongoClient.connect();
JavaScript
The following example illustrates how to use the exporter to enable monitoring for the MongoDB Node.js driver.
const MongoClient = require('mongodb');
const promClient = require( 'prom-client');
const exporter = require('@christiangalsterer/mongodb-driver-prometheus-exporter')

...

// set up the MongoDB client, monitorCommands needs to be set to true to enable command monitoring.
const mongoClient = new MongoClient("mongodb", { monitorCommands: true })

// set up the prometheus client
const collectDefaultMetrics = promClient.collectDefaultMetrics;
const Registry = promClient.Registry;
const register = new Registry();
collectDefaultMetrics({ register });

// monitor MongoDB driver
exporter.monitorMongoDBDriver(client, register);

...

// connect to MongoDB after calling monitorMongoDBDriver()
mongoClient.connect();
Configuration
The exporter can be configured via properties specified on the optional parameter of type MongoDBDriverExporterOptions.
| property | Description | Example | Since |
|---|---|---|---|
| mongodbDriverCommandsSecondsHistogramBuckets | Buckets for the mongodb_driver_commands_seconds_bucket metric in seconds. Default buckets are 0.001, 0.005, 0.01, 0.02, 0.03, 0.04, 0.05, 0.1, 0.2, 0.5, 1, 2, 5, 10 | 0.001, 0.005, 0.01, 0.02, 0.03, 0.04, 0.05, 0.1, 0.2, 0.5, 1, 2, 5, 10 | 1.0.0 |
| defaultLabels | Default labels added to each metrics. | {'foo':'bar', 'alice': 3} | 1.1.0 |
| prefix | Metric name prefix for all metrics. | 'service1_' | 2.1.0 |
Grafana Dashboard
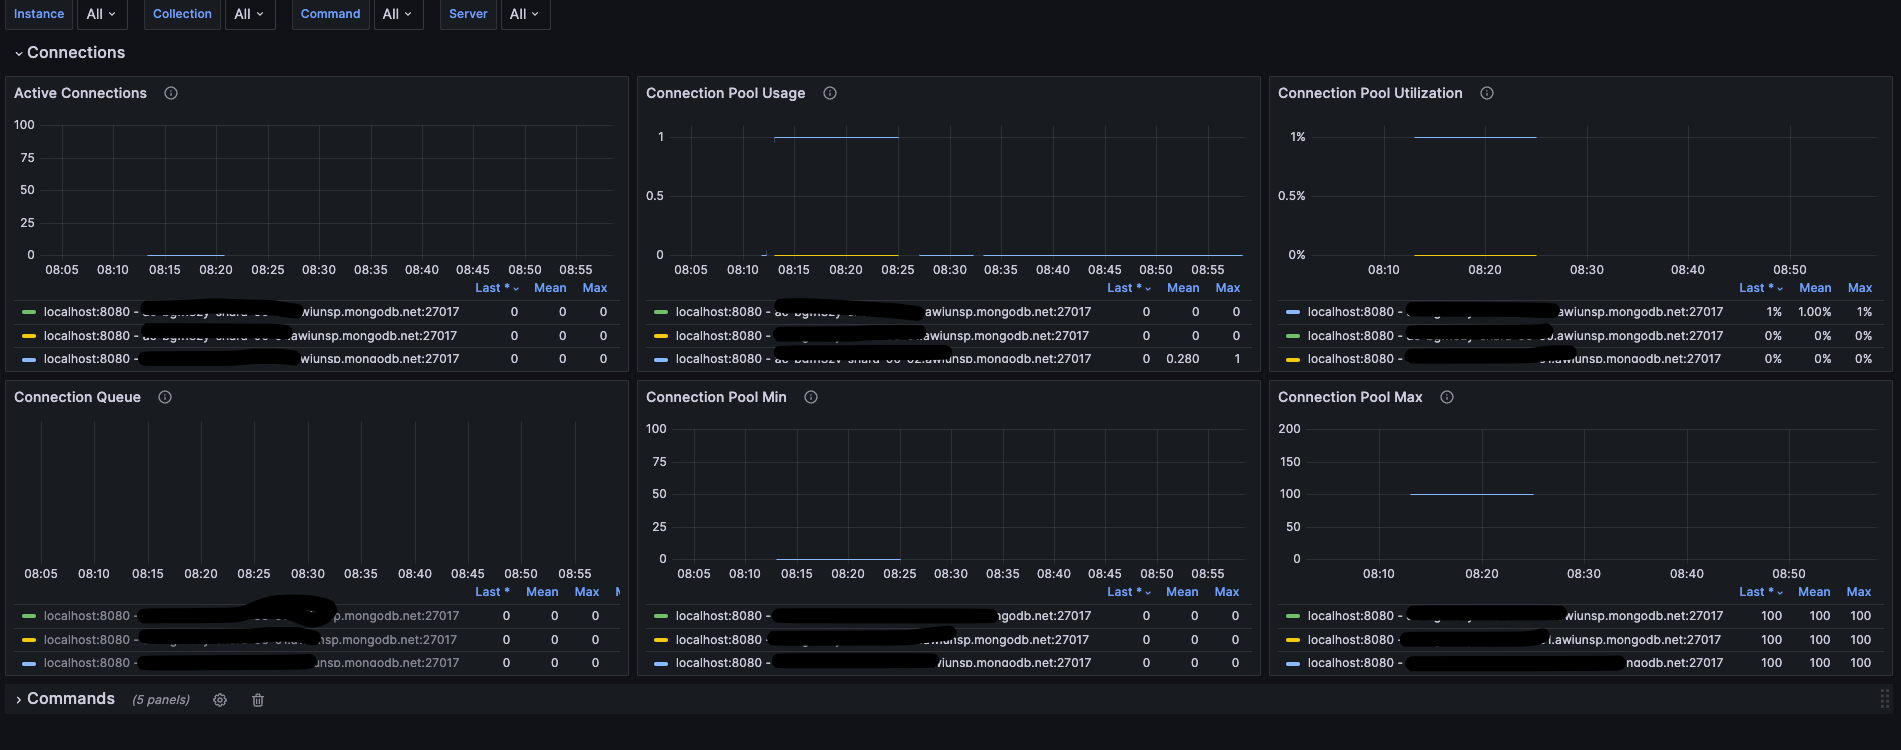
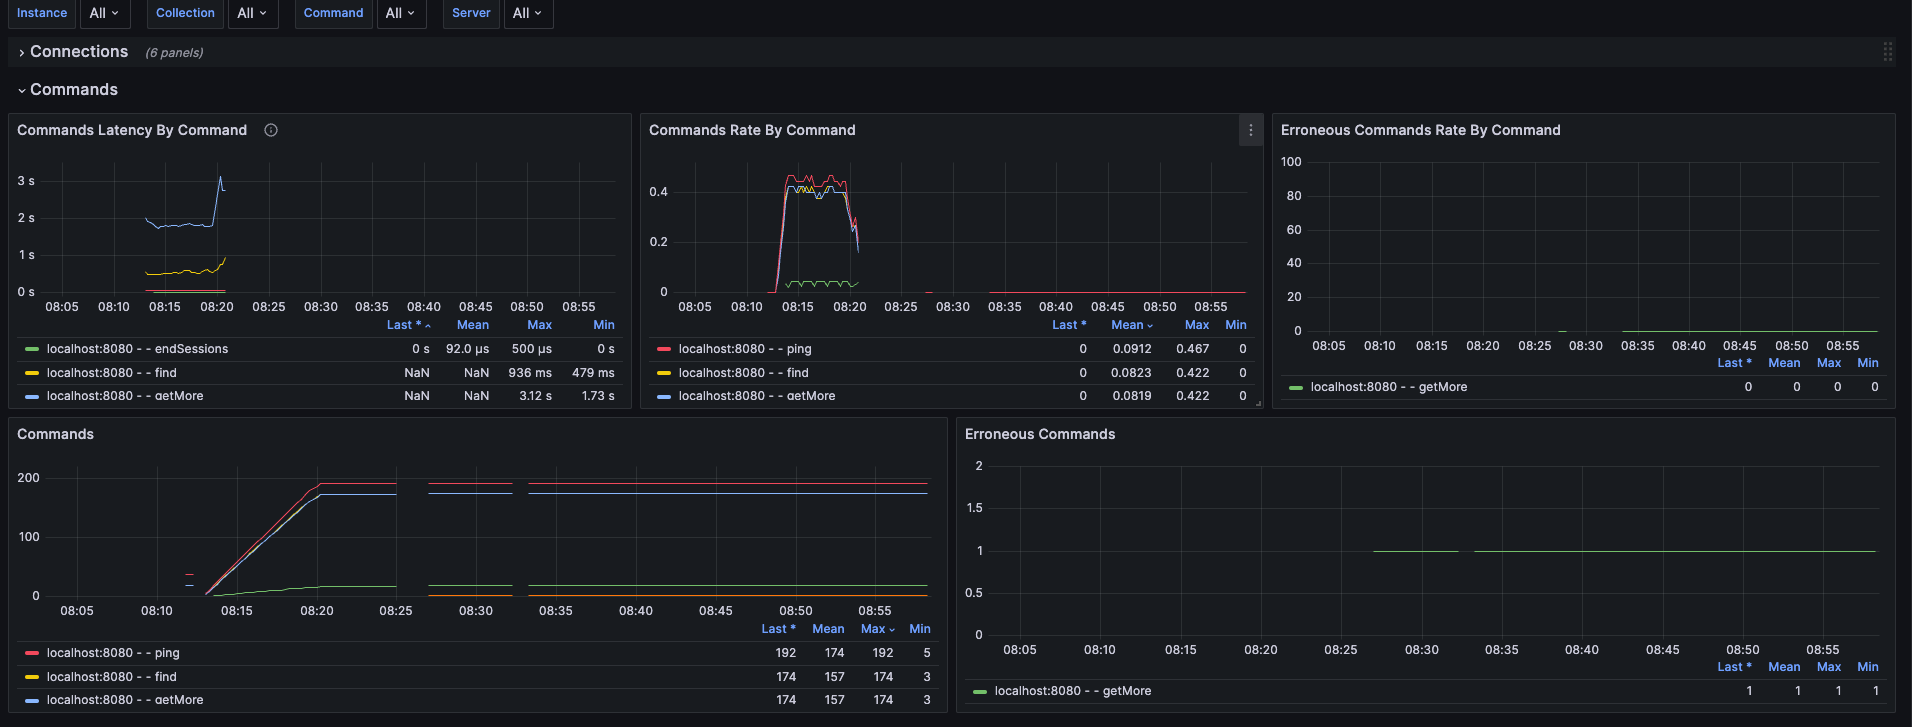
An example dashboard for Grafana is available here displaying the provided metrics by the exporter.
Here an example for collection metrics:

Here an example for command metrics:

Changelog
The changes to project can be found in the changelog.
Compatibility
The following table list the compatibility of exporter versions with different MongoDB Driver and prom-client versions.
| Exporter Version | MongoDB Driver Version | prom-client version |
|---|---|---|
| ^1.0.0 | ^5.8.0 | ^14.2.0 |
| ^2.0.0 | ^6.0.0 | ^15.0.0 |
Contributions
Contributions are highly welcome. If you want to contribute to this project please follow the steps described in the contribution guidelines.
Projects Using The Exporter
If you want to support this project, please add a link to your project and/or company when you use this exporter.
Related Projects
If you are looking for a way to monitor KafkaJS for Node.js you may have a look at https://github.com/christiangalsterer/kafkajs-prometheus-exporter.
If you are looking for a way to monitor node-postgres you may have a look at https://github.com/christiangalsterer/node-postgres-prometheus-exporter.


