@elaval/owid-vis-poc v0.3.6
owidVis : A Javascript library for building visualizations with data from Our World in Data
A Proof of concept
Our World in Data (OWID) is an initiative that aims at research and data to make progress against the world’s largest problems. They collect and mantain hundreds of public datasets which are the source of evidence based articles and data visualisations.
They currently have a visualization tool - OWID Grapher (https://github.com/owid/owid-grapher) - that has been designed to easily create, and publish, visualizations in a consistent format for different datasets.
But Grapher authors mention that
"This repo is currently not well-designed for reuse as a visualization library, nor for reproducing the full production environment we have at Our World in Data, as our tools are tightly coupled with our database structure."
My objective with owid-vis-poc (aka owidVis) is to explore a potential approach for creating a suite of visualization components that would:
- Allow for easy reutilization (a light weight javascript library that can use in web developments and publications)
- Decouple visualizations from the database
- Be designed for OWID data (assumes geographical & time dimensions)
- Be accesible for visualization developers to contribute and extend it
Quick overview
My idea is that we would develop a javascript library that will be distributed via standard channels (e.g. nmp @elaval/owid-vis-poc).
I suggest to visit this notebook that exemplifies how to retreive OWID data and render trend & barcharts in Observable.com: https://observablehq.com/@elaval/owid-visualisation-components-poc
Library architecture
Data structure
We will assume that the visualization library will consume datasets with a standard format (the library itself will not be responsible for retreiving / producing the data).
The assumption is that all data will have records with, at least, entityName, year and value
The data should also have an associated "unit" description that is part of the respective dataset metadata.
Library classes
The visualization library will export an object - owidVIS - that will provide a collection of chart building functions. For example:
- OWIDTrendChart(): Creates a line chart with values over years for available entities (countries)
- OWIDBarChart(): Creates a bar chart with values for different entities in a specific year
- OWIDMap(): Creates a world map with values for entities in a specific year ...
In the source code, all visualization are Javascript (actually TypeScript) classes that are derived from a parent class - OWIDChart - which provides elements and functions that are common to all visualizations.
Visualizations are represented as visual elements in the DOM which include a \ wrapper that contains a \ element which contains a \ element. This \ element will be the main container for all visual elements that constitute a specific chart (e.g. lines for TrendChart, rectangles for BarChart, axis, ...)
Most of the visual elements are created, configured and transformed using D3js (https://d3js.org/) which has became a de-facto library for data visualization.
Each visualization class provides a series of methods that allow the user to provide specific configurations.
For example, to create a trendChart that has "years" as the unit and a total width of 1000 pixels, we would use:
The node() method will return the DOM element (\) that contains the visualization and can be embedded in any html document.
Building the library
You can download the code from this respository and then
Install dependencies:
Build javascript code from Typescript sources (we use rolloutjs to create umd bundles) $ npm run build
Distribution library can be found at dist/owid-vis-poc.umd.js or dist/owid-vis-poc.umd.min.js
The library depends on "lodash" (which is included in the bundel) and d3js (which is not included in the bundle)
Users are expected to import d3.js in their projects
Characteristics of OWID data
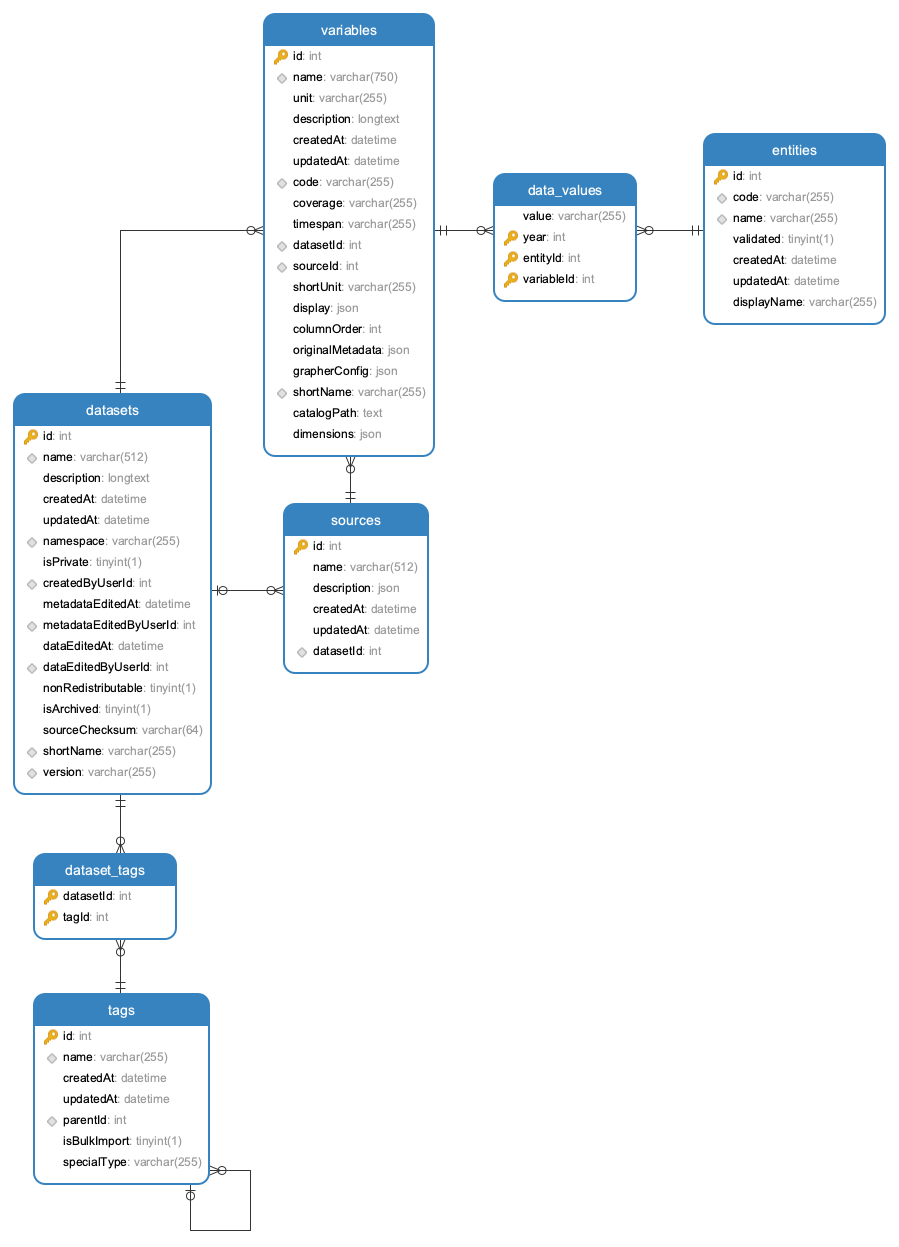
Current OWID Grappher consumes data from a MySQL database that is publicly distributed. When we look at the data model, we can identify some key concepts

- Datasets: are associated to a specific source and can contain a collection of variables (metrics)
- Tags: descriptors that are associated to datasets (e.g. "Population Growth"). Tags can have tag parents which allows to build a hierarchical structure of tags (e.g. "Population Growth" is a child of "Population Growth & Vital Statistics")
- Variables: multiple variables can be associated to a dataset. Each variable (e.g. "Fertility Rate") has a unit (e.g. "children per woman") and is associated to a table that contains a collection of data-values
- Data-Values: the actual data for a specific variable. Collection of records with values associated to time (year) and entities (countries, continents, ...).
- Entities have a name (e.g. "United Kingdom") and id (e.g. 1) and a code (e.g. GBR)
Once the user has selected a domain and dataset (e.g. "World Development Indicators - Economic Policy & Debt") and a specific variable from that dataset (e.g. "GDP per capita, PPP (constant 2011 international $)") then we are dealing with a selection of data values that will be used for visualizations.
The original Data Model has a normalized structure with a relationship between data-values and entities
For visualization purposes we will assume that data will be provided to the visualization in a denormalized form: