0.0.3 • Published 2 years ago
@opencodegraph/provider-prometheus v0.0.3
Prometheus context provider for OpenCodeGraph
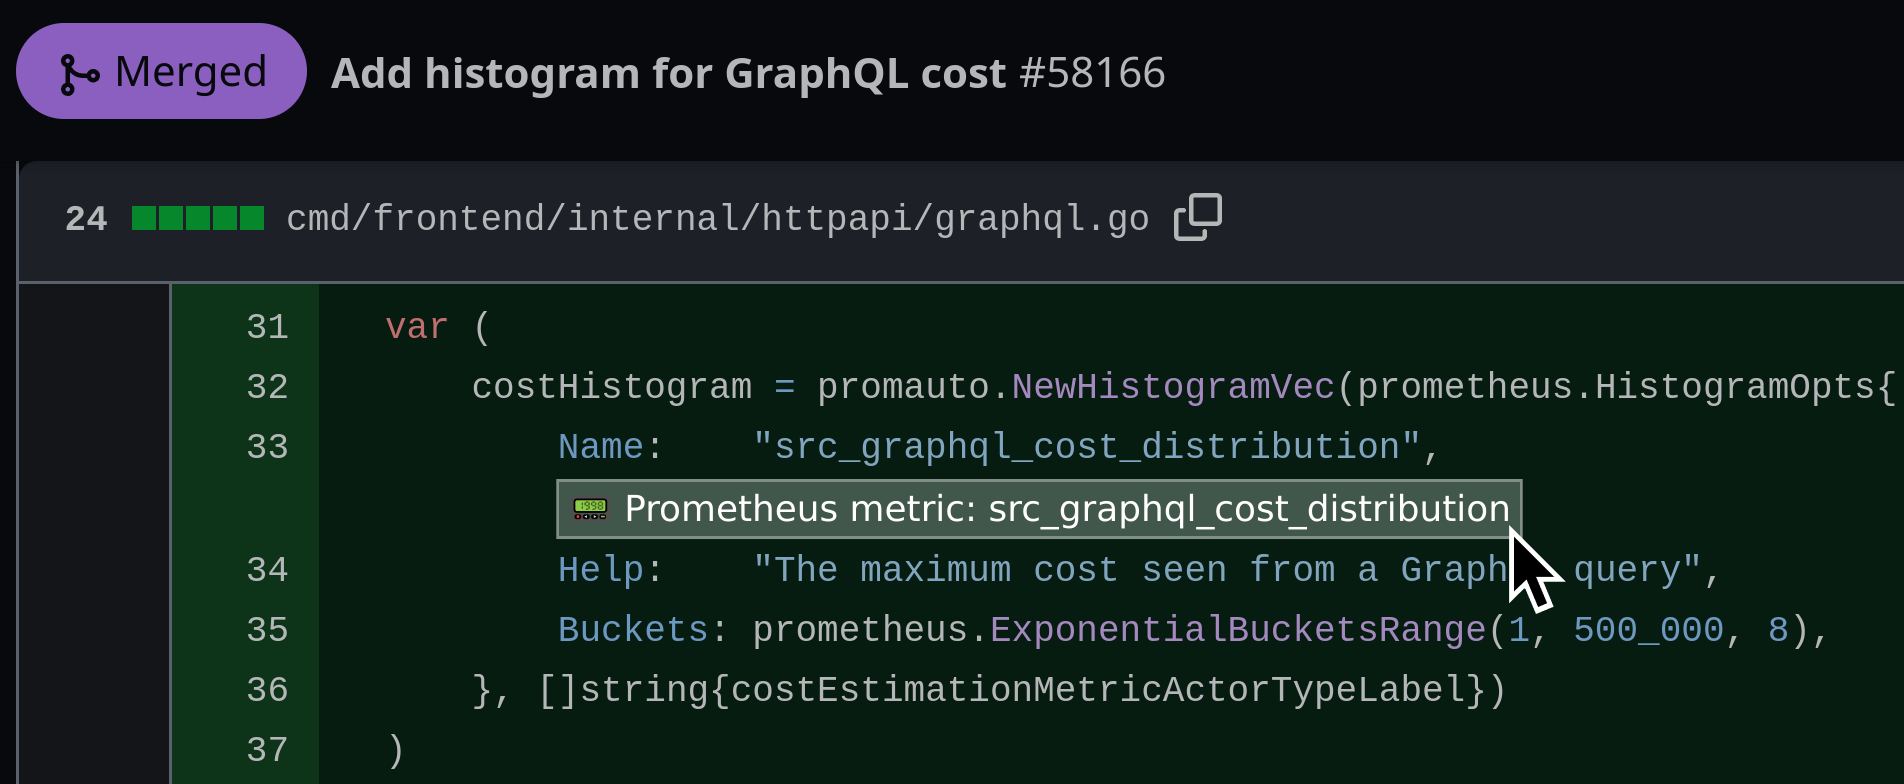
This is a context provider for OpenCodeGraph that lets you hover over a Prometheus metric's registration in your code to see what it's doing in prod and to click through to the live metrics on Prometheus, Grafana, or another metrics viewer.
Screenshot

Hover over a Prometheus metric registration in a GitHub PR to see what it's doing in prod
Visit the OpenCodeGraph playground for a live example.
Usage
Add the following to your settings in any OpenCodeGraph client:
"opencodegraph.providers": {
    // ...other providers...
    "https://opencodegraph.org/npm/@opencodegraph/provider-prometheus": {
        "metricRegistrationPatterns": [
            {
                "path": "**/*.go",
                "pattern": "prometheus\\.(?:Summary|Histogram)Opts{\\s*Name:\\s*\"([^\"]+)",
                "urlTemplate": "https://prometheus.example.com/graph?g0.expr=$1&g0.tab=0&g0.stacked=1"
            },
            {
                "path": "**/*.[tj]s",
                "pattern": "new promClient\\.(?:Summary|Histogram)\\({\\s*name: '([^']+)",
                "urlTemplate": "https://prometheus.example.com/graph?g0.expr=$1&g0.tab=0&g0.stacked=1"
            }
        ]
    }
},
Customize these metric registration patterns to match how your codebase registers Prometheus metrics.
See "Configuration" for more.
Tips:
- If you're using VS Code, you can put the snippet above in
.vscode/settings.jsonin the repository or workspace root to configure per-repository links. - Play around with the Prometheus provider in realtime on the OpenCodeGraph playground.
Configuration
/** Settings for the Prometheus OpenCodeGraph provider. */
export interface Settings {
  /**
   * Patterns that match metric registrations.
   */
  metricRegistrationPatterns?: MetricRegistrationPattern[]
}

interface MetricRegistrationPattern {
  /**
   * Glob pattern matching the file URIs in which to search for this pattern.
   */
  path: string

  /**
   * Regexp pattern whose first capture group matches the metric name.
   *
   * @example `prometheus\\.HistogramOpts{\s*Name:\s*"([^"]+)`
   * @example `new promClient\\.Histogram\\({\\s*name: '([^']+)`
   */
  pattern: string

  /**
   * The URL to view matching metrics on Prometheus, Grafana, or another metrics viewer, with $1
   * replaced by the metric name.
   *
   * @example https://prometheus.demo.do.prometheus.io/graph?g0.expr=$1&g0.tab=0
   * @example https://grafana.example.com/explore?left=%5B%22now-6h%22,%22now%22,%22Prometheus%22,%7B%22expr%22:%22$1%22%7D%5D
   */
  urlTemplate: string
}
Development
- Source code
- Docs
- License: Apache 2.0