1.0.0 • Published 6 years ago
@petarnenov/vizbacktrack v1.0.0
Visualization BackTrack Algorithm
Installation steps
Prerequisites
Git
NodeJS
Docker not necessary but recommended
Clone repository
```bash
cd ~
mkdir nodejs_projects
cd nodejs_projects
git clone https://github.com/petarnenovpetrov/vizbacktrack.git
cd vizbacktrack
npm install

```
If you have installed Docker on a local machine, just go
OR
```bash
npm run dev:serve

```
and go to
Usage
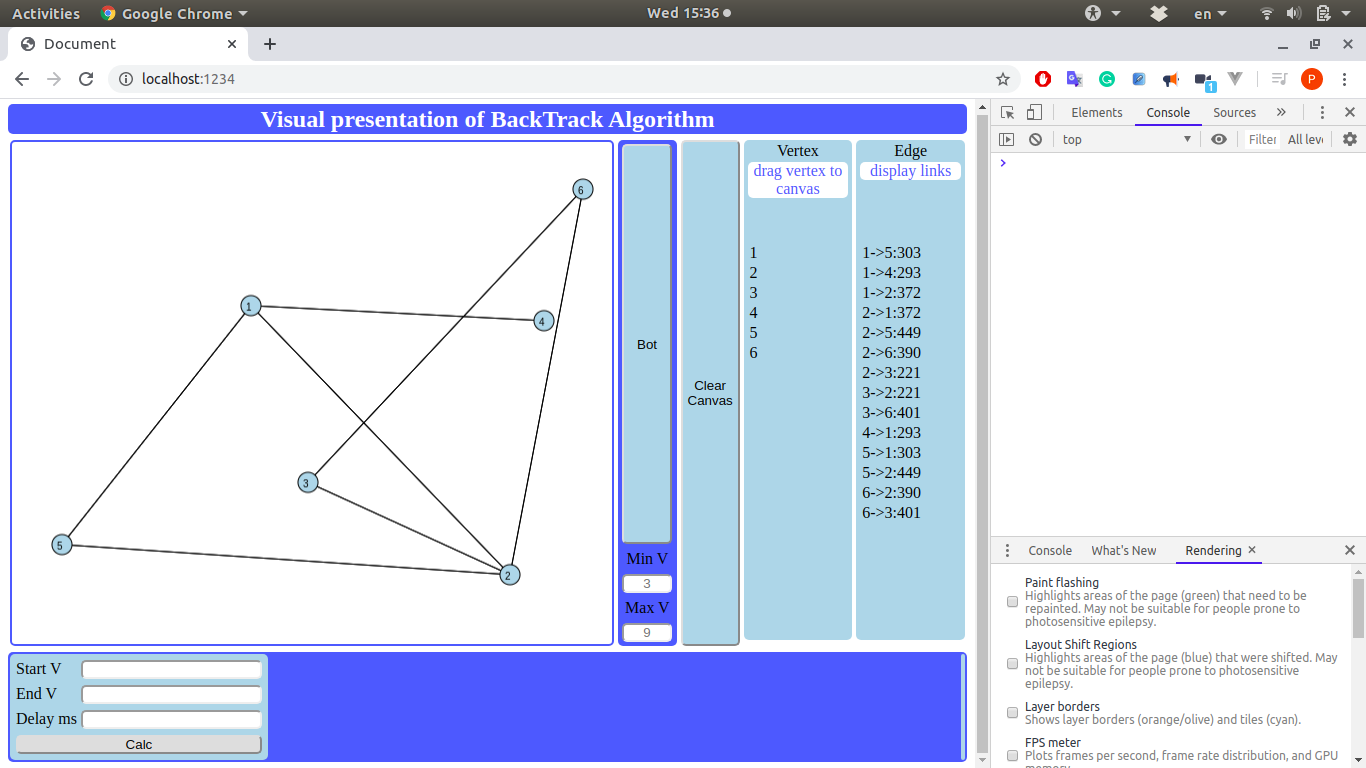
Fast demo with random vertexes from 3 to 9 and random edges between them
1. Click button "Bot";
2. In form bottom left add:
   1. number of start Vertex / 1 /
   2. number of end Vertex / N /
   3. delay in ms / 500 /
   4. push "Calc"
3. To clear all click button "Clear Canvas"
4. Step 1
5. To preset range of random vertexes
   1. Feel the fields minV and maxV
   2. By default minV = 3 and maxV = 9
6. Step 1
Manual step:
1. Drag&Drop "vertex" to canvas to create a vertex
2. Add min two vertexes
3. Click in vertex circle and drag to another vertex circle to create an edge
4. Create as many as you want edges and vertexes.
5. Goto to step 2 in Fast demo;
Results
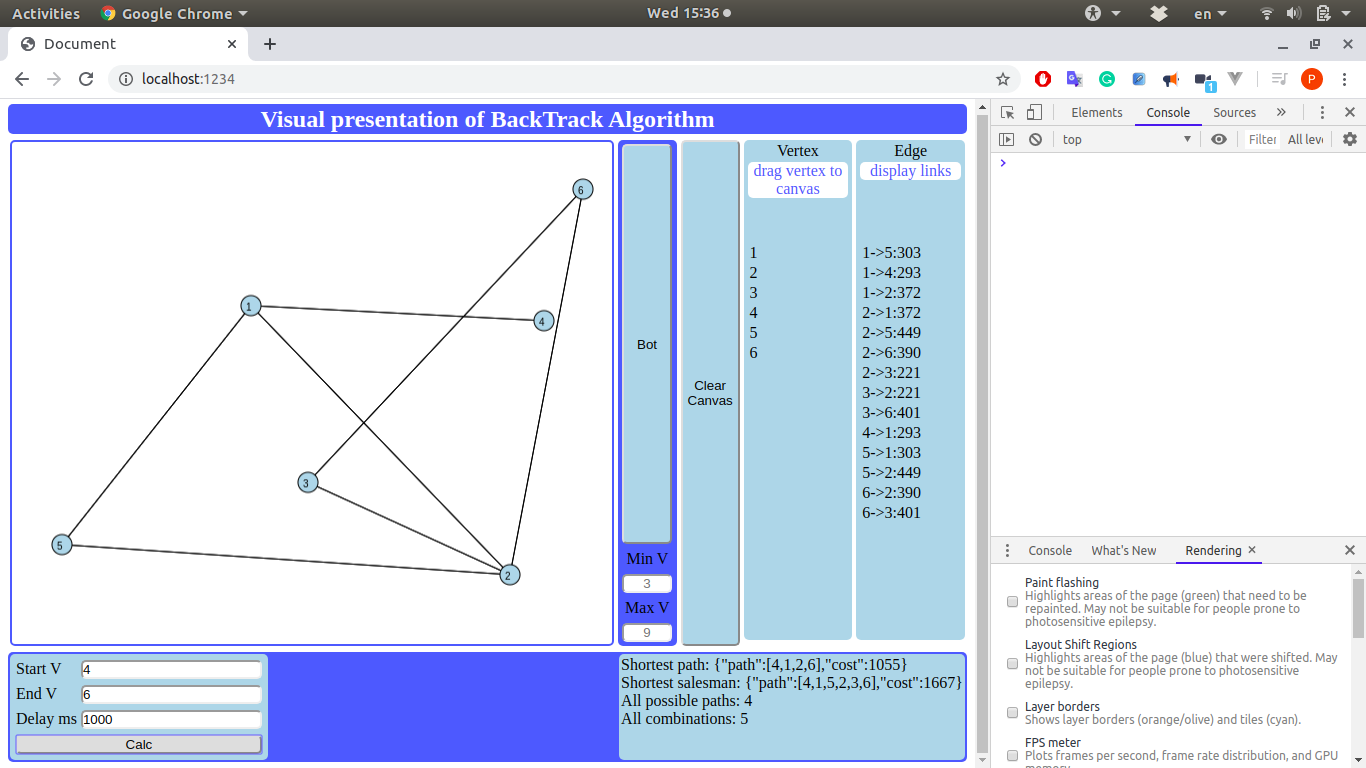
1. In bottom right corner will displays:
   1. The shortest path from the start vertex to end vertex
   2. If the salesman problem is resolved then will show the path or undefined if not
   3. All possible combinations to reach end vertex from the start vertex
   4. All combinations
2. In canvas
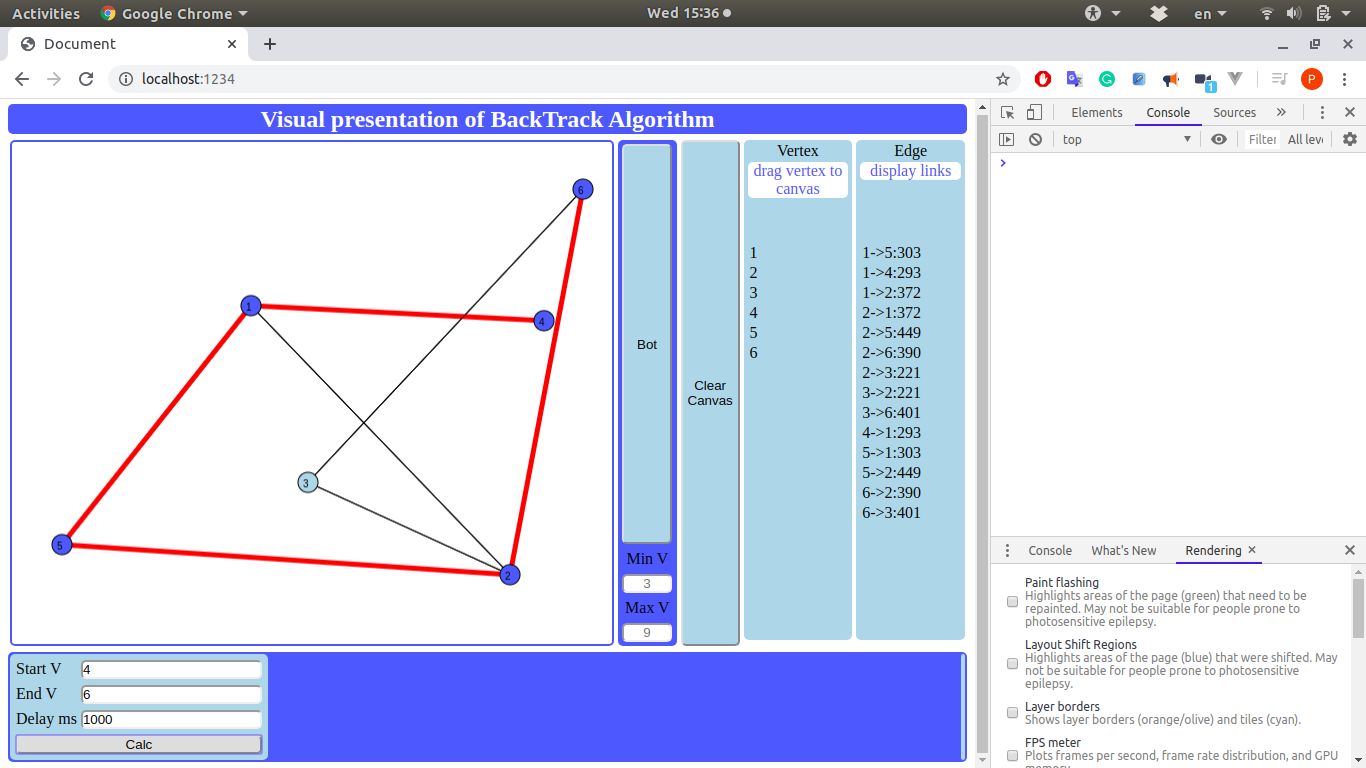
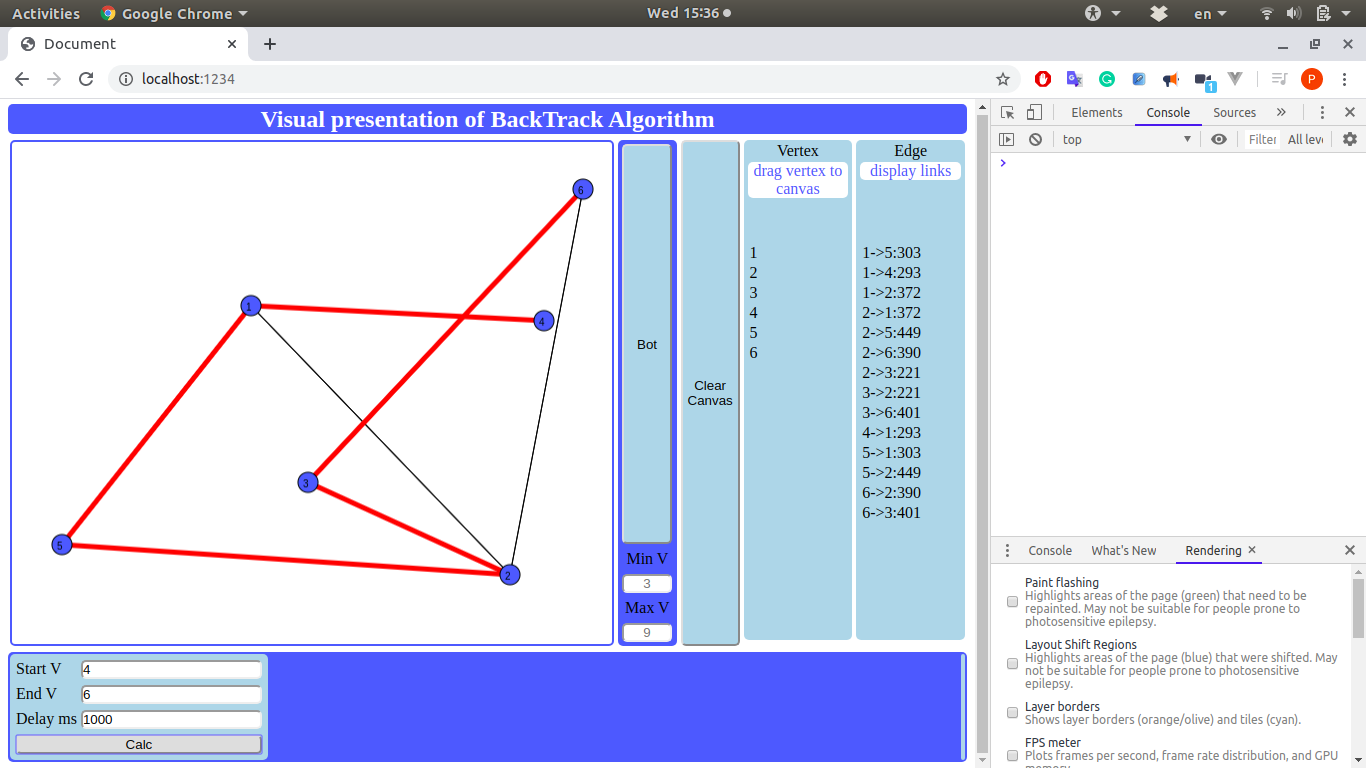
   during the calculations
   will show all currently used vertexes in DODGERBLUE and edges in BOLD RED
3. Explanations:
   1. 1->2:345 , means vertex 1 is connected to vertex 2 and edge length is 345px
   2. cost:456 , means distance in pixels, 456px


1.0.0
6 years ago