0.2.2 • Published 3 years ago
@sakamoto66/playwright-markdown-timeline-reporter v0.2.2
playwright-markdown-timeline-reporter
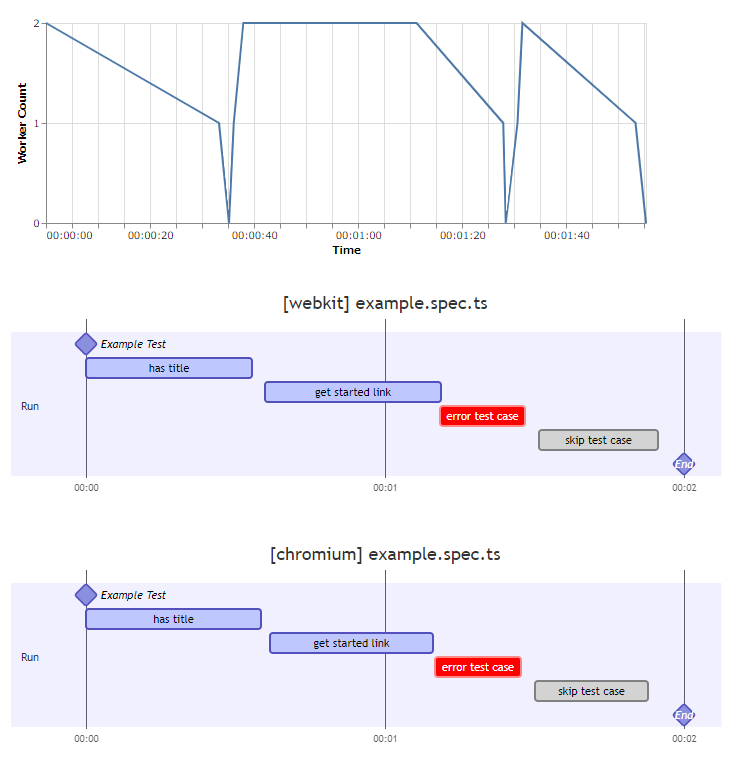
The playwright-markdown-timeline-reporter is a powerful library designed to convert Playwright test results into visually intuitive Markdown Gantt charts. It transforms test progression and dependencies into easy-to-read graphical timelines, thus promoting more effective analysis and understanding.
Features
- Markdown Gantt chart generation: The library processes Playwright test results to create Gantt charts in Markdown format. Each test case is represented by a bar on the timeline, indicating its commencement and completion times. Additionally, dependencies between test cases are illustrated via interconnected lines, making the test flow clearer.
Usage
- Install the playwright-markdown-timeline-reporter library:
npm i -D @sakamoto66/playwright-markdown-timeline-reporter- To use a reporter define it in playwright.config.ts as reporter:
- playwright.config.ts
import { defineConfig, devices } from '@playwright/test';

export default defineConfig({
  reporter: [
    [ '@sakamoto66/playwright-markdown-timeline-reporter', { outputFile: 'timeline.md', header:'## Timeline', footer:'footer comment' } ]
  ],
})
Options
| Option | Required | Description |
|---|---|---|
| outputFile | Optional | Specifies the output file. If omitted, results are output to standard out. If the file extension is .html, the content will be output as HTML. Otherwise, it will be output as Markdown. |
| header | Optional | Adds a custom message at the beginning of the output content. |
| footer | Optional | Adds a custom message at the end of the output content. |
| workerGraphWidth | Optional | Specifies the width of the parallel graph. The default value is 600. |
Output Example

License
The playwright-markdown-timeline-reporter project is under the MIT License. For more details, refer to the LICENSE file.
