0.1.0 • Published 6 years ago
@skymaker/litegraph.js v0.1.0
litegraph.js
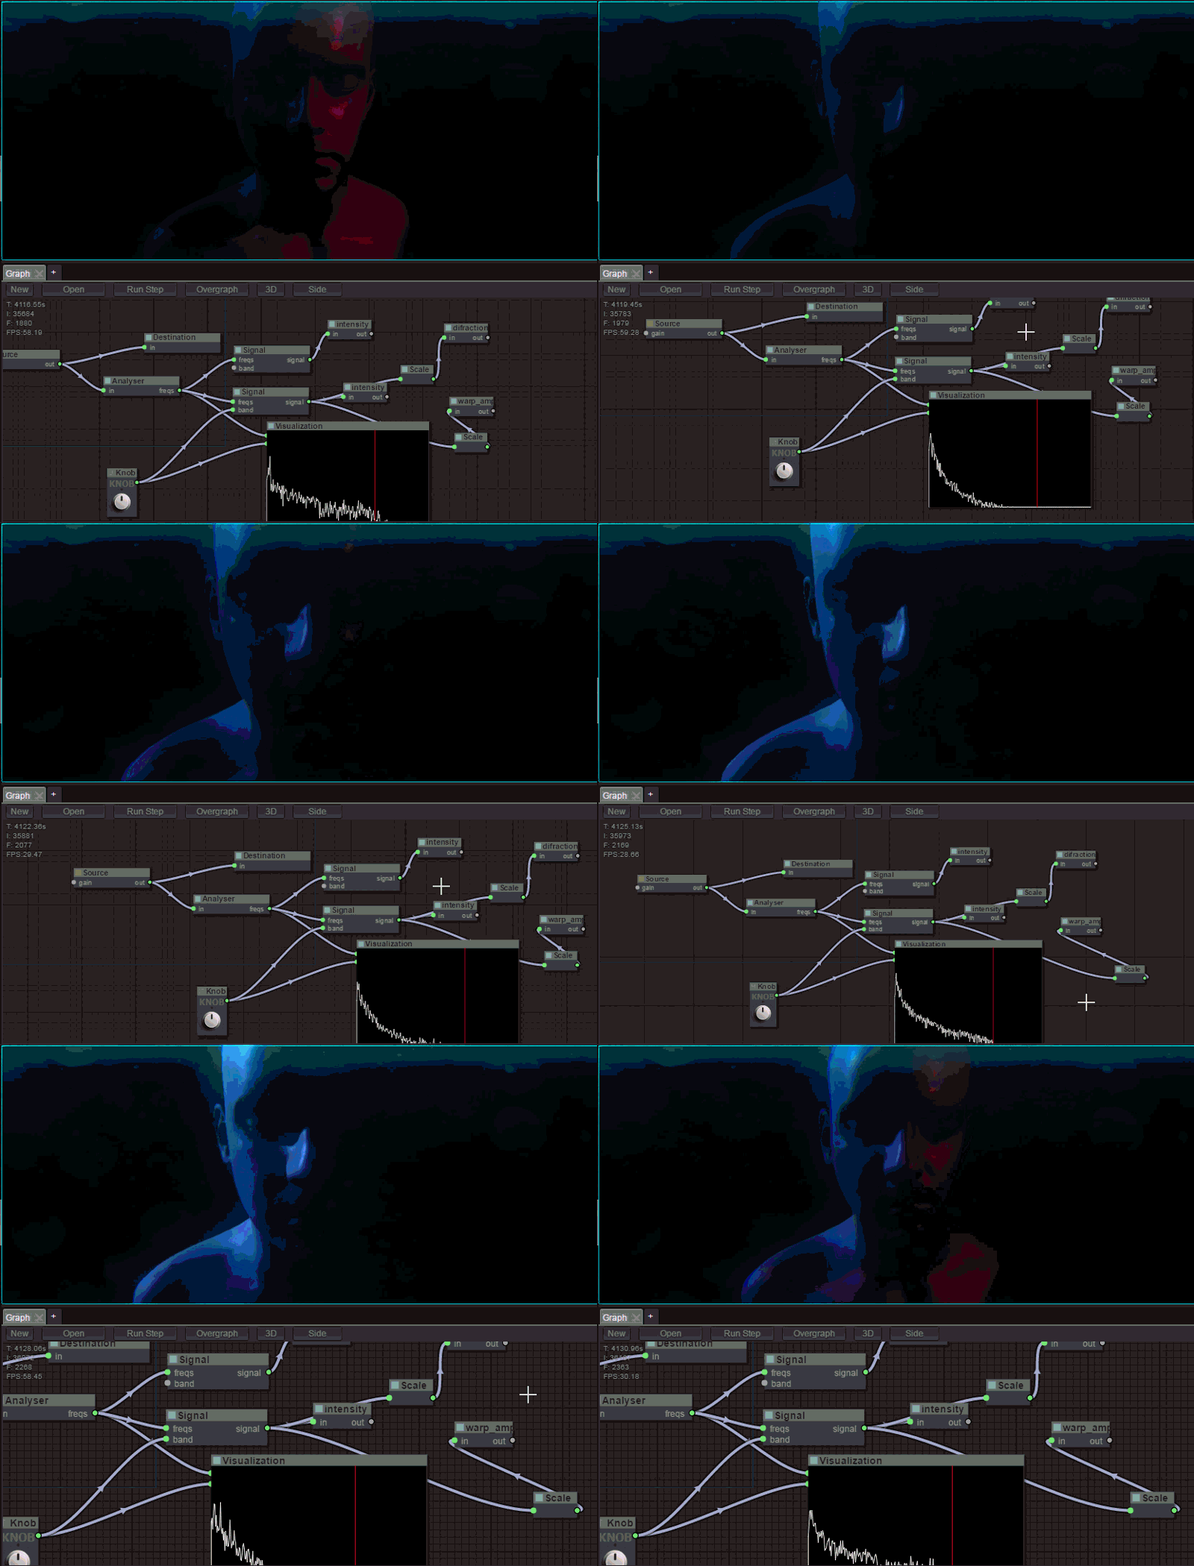
A library in Javascript to create graphs in the browser similar to PureData. Nodes can be programmed easily and it includes an editor to construct the graphs.
It can be integrated easily in any existing web applications and graphs can be run without the need of the editor.
Creating a Graph
You can create graphs from the editor (and store them in JSON) or directly from code:
var graph = new LGraph();
var node = LiteGraph.createNode("basic/const");
var node2 = LiteGraph.createNode("basic/watch");
graph.add( node );
graph.add( node2 );
node.connect(0, node2, 0); //connect node slot 0 to node2 slot 0

graph.runStep(1); //execute one cycle
How to code a new Node type
Here is an example of how to build a node that sums two inputs:
//node constructor class
function MyAddNode()
{
  this.addInput("A","number");
  this.addInput("B","number");
  this.addOutput("A+B","number");
}

//name to show
MyAddNode.title = "Sum";

//function to call when the node is executed
MyAddNode.prototype.onExecute = function()
{
  var A = this.getInputData(0);
  if( A === undefined )
    A = 0;
  var B = this.getInputData(1);
  if( B === undefined )
    B = 0;
  this.setOutputData( 0, A + B );
}

//register in the system
LiteGraph.registerNodeType("basic/sum", MyAddNode );
Projects using it
webglstudio.org

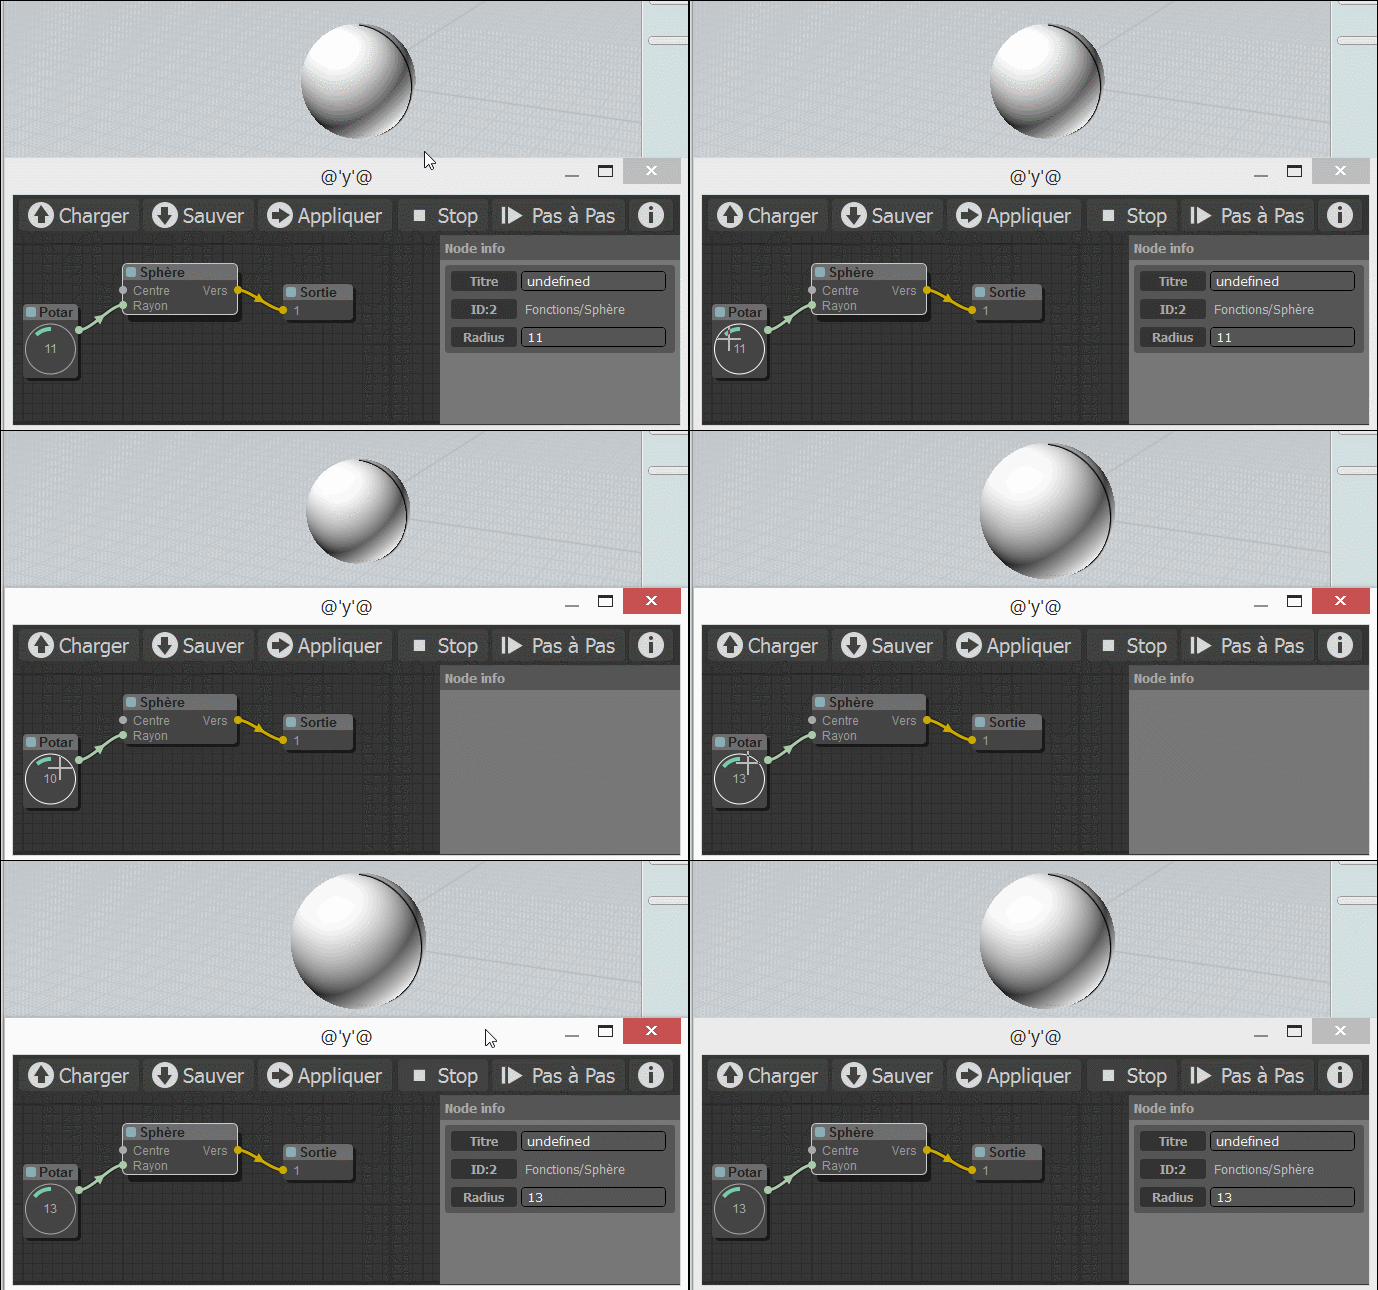
MOI Elephant

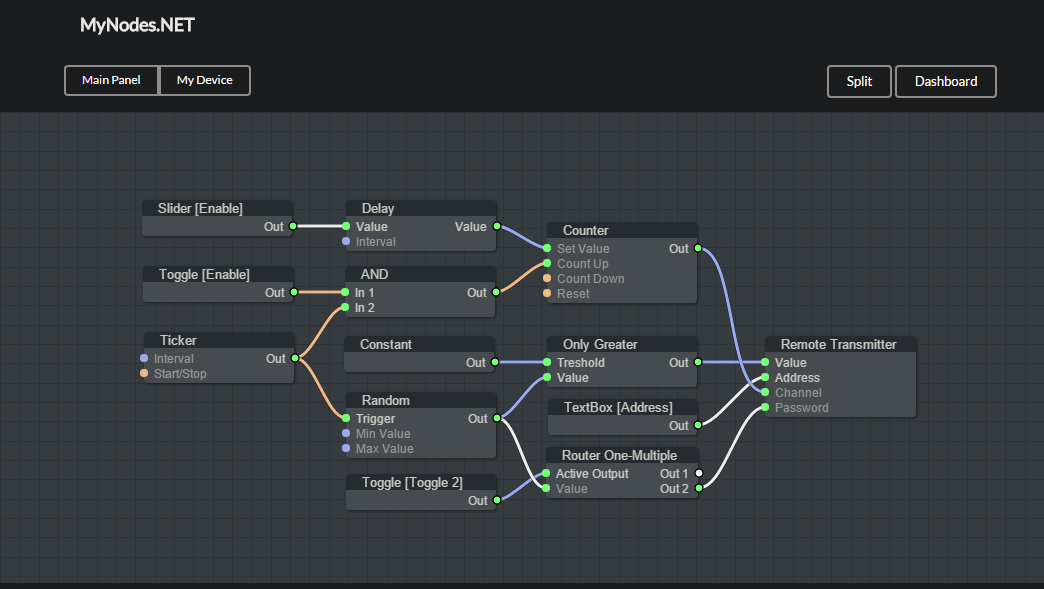
Mynodes.NET

Utils
It includes several commands in the utils folder to generate doc, check errors and build minifyed version.
Feedback
You can write any feedback to javi.agenjo@gmail.com
0.1.0
6 years ago