@vidro/map-handler v1.3.2
Map Handler
Version 1.2.191 - February 2025
Tool to achieve the easiest way of communication with the map iframe.
Some of the multiple use case flows are documented in flows.md
TL;DR
<html>
  <body>
    <iframe id="map-frame" name="map-frame" src=""></iframe>
    <button id="btZoomIn">Zoom In</button>
    <script src="https://unpkg.com/@vidro/map-handler@1.0.5/dist/map-handler.js"></script> -->
    <script>
      var loadMapReq = new XMLHttpRequest();
      loadMapReq.addEventListener("load", function(){
        communicator = new VidroMaps.Communicator({this.responseText.message.sessionToken});
        document.querySelector("#map-frame").src = `${this.responseText.message.iframe}?sessionToken=${this.responseText.message.sessionToken}`;

        document.querySelector("#btZoomIn").addEventListener("click", function(){
          communicator.ZoomIn();
        });

      }
      loadMapReq.open("GET", "http://APIURL/map/PROJECT_ID",true);
      loadMapReq.setRequestHeader('Content-type', 'application/json');
      loadMapReq.setRequestHeader('Authorization',`Bearer ${USER_TOKEN}`);
      loadMapReq.send();
    </script>
  </body>
</html>
Installation
0. Pre-requisites
You should have one iframe already created on the DOM with the attributes name="map-frame" id="map-frame".
1. Include the library:
You can do this inyecting directly to window:
<script src="path/to/lib.js"></script>
<script src="path/to/your.js"></script>
Or if you're working with NPM / ES6:
npm install --save @vidro/map-handler
...
import { Communicator } from "@vidro/map-handler";
2. Instance the communicator with the sessionToken in options object:
If you are inyecting into window:
var communicator = new VidroMaps.Communicator({
  sessionToken: sessionToken
});
Or if you're working with NPM / ES6:
const communicator = new Communicator({
    sessionToken: "sessionToken"
});
Logs
If you want to see console.logs, you can activate logs with setDebug method. Once map is loaded, invoke this method. Will create or remove a cookie. After calling setDebug reload the map.
Logs are deactivated by default.
setDebug(debug)
E.G.
//activate
setDebug(1);

//deactivate
setDebug(0);
Events
How to listen
communicator.on("onZoomChange", function(data){
  console.log("onZoomChange event",data);
});
Available events
Available Events
onZoomChange
The onZoomChange event is triggered whenever the zoom level of the map changes. This event provides detailed metadata about the new zoom state, including the current zoom level, map extent, resolution, and scale.
The event returns an object with the following properties:
| Property | Type | Description |
|---|---|---|
type | string | The event type, always "onZoomChange". |
zoom | number | The current zoom level after the change. |
maxZoom | number | The maximum zoom level allowed in the map. |
minZoom | number | The minimum zoom level allowed in the map. |
extent | array | The map extent after zooming, represented as [minX, minY, maxX, maxY]. |
resolution | number | The resolution of the map at the current zoom level. |
scale | string | The approximate scale of the map in the format "1:xxxx". |
{
  "type": "onZoomChange",
  "zoom": 15.035190437015496,
  "maxZoom": 25,
  "minZoom": 0,
  "extent": [448455.99940588913, 4595273.644846473, 456909.8853950997, 4602082.14362973],
  "resolution": 4.656975911940399,
  "scale": "1:17600"
}
geomAdded
Notifies geometry added to map and featureId
When this tool is used, NO geom is added when drawing finishes. In case you want to add it, use Highlight tool
E.G.
geom_astext: "POLYGON((418391.8715694032 4576832.484383419,418721.82301488414 4577299.667608328,418727.18131229794 4576947.724919814,418391.8715694032 4576832.484383419))"
featureId: "uuid of geometry added'
srid: 'EPSG:25831'
loaded
Notifies when map or layers are loaded.
There're two types of events:
mapis dispatched when map (with background) is loaded.layeris dispatched when a layer is loaded -zIndex: layer z-indextiledis dispatched when a tiled is loaded
mapE.G:
{what:'map'}
layerE.G:
{what:'layer'
name:'Arc'
zIndex:998}
unloaded
Notifies when layers are unloaded.
There's one type of events:
layeris dispatched when a layer is unloadedtiledis dispatched when a tiled is unloaded
layerE.G:
{what:'layer'
name:'Arc'}
layers
Notifies an array of displayed layers
geoJSONlayers
Notifies an array of displayed GeoJSON layers
activeLayer
Notifies wich layer is marked as active
WMSInfoAvailable
Notifies when WMS is available for this map
availableWMSLayers
List of available layers from WMS server
getToc
Formatted Layers TOC (table of contents)
coordinates
Notifies clicked coordinates (x,y), a BBOX in WKT and map srid
BBOX by default is a 20m box. You can customize this value with method setBboxSize
First coordinate is X value.
E.G:
{
coordinates: (2) [419463.63262834214, 4577166.970846243],
bbox: "POLYGON((452249.04604797193 4599115.704682493,452254.04604797193 4599115.704682493,452254.04604797193 4599120.704682493,452249.04604797193 4599120.704682493,452249.04604797193 4599115.704682493))",
srid: "EPSG:25831",
type: "coordinates"}
info
Notifies info results. There're 2 availables infos wms and giswater
E.G
wms:
{type: "info", infoType: "wms", data: "<GetFeatureInfoResponse>↵ <Layer name="Incidencia_… </Feature>↵ </Layer>↵</GetFeatureInfoResponse>↵"}E.G
giswater:
{type: "info", infoType: "giswater", data: {…}}layerElements
Receives a list of elements from a `getElementsFromLayer request
{type: "layerElements", data: {xml or json}}geolocation
Notifies user position, coordinates (x,y)
First coordinate is X value.
E.G
{type: "geolocation", coordinates: Array(2)}
coordinates: (2) [419297.8249458591, 4576821.519666988]
Giswater tiled background
Giswater's tiled background has two events, one for notify if is available or not, and a another one for notify if is rendered or not
giswaterTiledBackgroundAvailable and giswaterTiledBackgroundDisplayed
{type: "giswaterTiledBackgroundAvailable", available: true/false}

{type: "giswaterTiledBackgroundDisplayed", visible: true/false, tiled: "tiled id"}
Giswater layer Available filters
List of available filters for a Giswater layer
{type: "GiswaterLayerAvailableFilters", filters: array}error
Notifies errors
E.G.
{type: "error", error: "No clicked coordinates"}status
Notifies map status, as tiled loaded, background visible, etc..
hover
When user puts mouse pointer over a feauture for more than 1 second, a hover event is dispatched.
If is no hover any feature event is dispatched with feature:null
E.G
{type: "hover", feature: {'property':'somevalue',...}screenshot
This feature provides screenshot data, encoded as a PNG in Base64 format.
E.G
{type: "screenshot", content: 'png in base64'Methods
ZoomIn()
ZoomOut()
zoomToExtent()
zoomToCoordinates(coordinates,zoomLevel)
Zooms to given coordinates
Params
- lat (x)
<integer> - long (y)
<integer> - zoomLevel
<integer>- zoom level
E.G.
zoomToCoordinates(419006.12985785044, 4576698.8136144625,18);zoomToGeometry
Zooms to a given geometry
Params
- geom
<string>WKT geometry limits
<json>max/min zoom level- max
<integer> - min
<integer>
E.G.
- max
zoomToCoordinates(419006.12985785044, 4576698.8136144625,18);zoomToGeometry(lat,long)
center map to given coordinates
Params
- lat (x)
<integer> - long (y)
<integer>
E.G.
CenterMap(419006.12985785044, 4576698.8136144625,18);zoomToScale(scale)
Sets the zoom level to a specified scale.
Allowed Scales:
1:1001:2001:4001:5001:10001:20001:50001:100001:50000
Params
scale<string>- The scale to set the zoom level.
E.G:
zoomToScale('1:100');AddGeom(string)
Launches drawing tools with the geometry type
Params
- geom
<string>- geometry typePoint|Line|Polygon
Optional parameters
texts(object): Texts to be displayed with draw tools.start(string): E.G. "Click to start drawing"continnue:(string): E.G. "Click to to continue drawing"
center(object): Center options.style(object):fill(string): The fill color for the drawn geometry.stroke(string): The stroke color for the drawn geometry.
drawOnEnd(boolean): Is is set tofalsegeometry will not be added on end drawing. The event with the drawn geometry will still be emittedshowConfirm(boolean): show or hide component for end drawing. If is set to false,CancelAddGeom()must be handled by the user.
Confirm component:

CancelAddGeom
Cancels draw geometry
E.G.
CancelAddGeom();E.G.
AddGeom('Point');

AddGeom('Line');

AddGeom('Polygon');

//Draw polygon with no showConfirm
AddGeom('Polygon', {showConfirm: false});
An geomAdded event will be received after calling the method.
addIcon(icon,coordinates)
Add an icon on a given coordinates
Params
- icon
<ArrayBuffer>- The binary data of the icon image, typically obtained by converting an image file (e.g., PNG) to anArrayBuffer. This should represent the visual marker to be displayed on the map. - coordintes
<array>- An array specifying the location where the icon should be added. Format:[longitude, latitude]. Ensure the coordinates are in the same SRID (Spatial Reference Identifier) as the map being used (e.g., EPSG:4326 for geographic coordinates). Transform the coordinates if necessary before passing them to this method.
// Fetch and process the image as binary data
const iconBinaryData =  convert to binary method (`path/images/icons/anIcon.png`);

addIcon(iconBinaryData, [2, 4.6]);
ArrayBuffer conversion examples
setBboxSize
Set the BBOX size of clicked coordinates. When the receives a click events, calculates an bounding box of bboxsize meters.
E.G.
setBboxSize(5); //set a bbox of 5 metersclear()
Clears drawn geometries
toggleLayer
Shows/hides a layer.
*Important
This method loads a single layer. If you need to load multiple layers, use loadMultipleLayers() method
If ypu need to load multiple layers
Params
- layerName
<string>- layer name - properties
<object>- optional layer properties- gutter
<integer>- The size in pixels of the gutter around image tiles to ignore, only applies for multitile layer - singletile
<boolean>- SingleTile Layer - transparent
<boolean>- Transparent Layer - type
<string>- layer type (wms, geojson...)
- gutter
By default, layer properties will be:
gutter: 0
singletile: false - will render a multitile layer
transparent: true
E.G.
With no properties
toggleLayer('somelayer_name');With properties
toggleLayer('somelayer_name', {gutter: 10, transparent: false, singletile: false);toggleGroup
Toggles (show/hide) a list of layers. Layers must be loaded before with loadMultipleLayers
layers
<array>:
loadMultipleLayers()
Loads multiple layers. Use this method if you want to load multiple layers.
Params
- layers
<array>: array of layers, each layer with same proerties thantoggleLayermethod.
setActiveLayer()
Sets a layer as acticve layer, used for infos
E.G.
setActiveLayer('somelayer_name');removeLayer(layer_name)
Removes a layer
E.G.
removeLayer('somelayer_name');displayLayer(layer_name)
Displays a layer
E.G.
displayLayer('somelayer_name');reloadDisplayedLayers
Reloads displayed layers
E.G.
reloadDisplayedLayers();loadWMSAvailableLayers
Gets a list of available layers from WMS server
E.G.
loadWMSAvailableLayers();An availableWMSLayers event will be received after calling the method.
bringLayerToTop
Params
- layer_name
<string>: layer name
Brings layer to top.
E.G.
bringLayerToTop('somelayer_name');bringLayerToBottom
Params
- layer_name
<string>: layer name
Brings layer to bottom.
E.G.
bringLayerToBottom('somelayer_name');getToc
Gets a formatted Layers TOC (Table of contents)
E.G.
getToc();An getToc event will be received after calling the method.
getElementsFromLayer
Gets a list of elements from a layer, based on a WMS request
getElementsFromLayer(layer,limit,format)Params
- layer
<string>- layer name - limit
<integer>- limit output number of elements (default 100) - format
<string>- output formatxml- defaultjson
infoFromCoordinates
There're two available info from coordinates wms or giswater.
Important a click on the map must be done before calling this method.
If you don't specify a layer, will use the layer setted as Active layer
Params
type
<string>- info typewms- wms infogiswater- giswater infogeojson- geojson info
layer
<string>optional layer name to do info. If null, will use current active layer.- hitTolerance
<integer>optional for geoJSON Info, pixels inside the radius around the given will be checked for features. Default5. - format
<string>optional - output format for WMS requestsxml- defaultjson
E.G.
infoFromCoordinates('wms'); //will use active layer

infoFromCoordinates('giswater');
infoFromCoordinates('giswater','Arc');
infoFromCoordinates('wms','Arc',null,'json'); //will use active layer and json output
An info event will be received after calling the method.
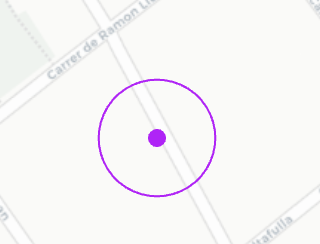
Geolocalize
Geolocalizes user. Will dispatch geolocation event .
Params
- toggle
<Boolean>- starts or cancels geolocation - options
<json>- optional - track<Boolean>- will track user position or geolocalize only once
E.G.
//start
Geolocalize(true)
Geolocalize(true, {track:true})

//cancel
Geolocalize(false)
Important Add allow="geolocation" to html iframe tag.
Higlight
Highlights & draws a geometry. Allows animation and zoom to element.
If you want to draw a geom, just use DrawGeometries method
Params
geom(string): The geometry string in WKT to highlight.
Optional parameters
zoom(object): Zoom options.type(string): The type of zoom (levelorelement).level: Zoom to a specific zoom level.element: Zoom to the center of the geometry.
zoomLevel(number, optional): The zoom level (1 to 28). Required iftypeis set tolevel.
center(object): Center options. -falsewill not center map to element -1will center always map to element -2will center element only if is outside current view extentdata(object): Additional data associated with the highlight.feautureId(string): The ID of the feature.name(string): The name of the feature.- ... any extra data will be added to feature
- style (
object): geometry styling optionsfill(string): The fill color for the highlighted geometry.stroke(string): The stroke color for the highlighted geometry.
animate(boolean): Indicates whether to animate the highlight.duration: time of the animation in millisecondsrepeat: true/false for repeteating animation
Example of animation

E.G.
//Highlight a line and zoom to level 6

let options = {
	'geom': 'MULTILINESTRING((418596.62555076234 4577083.383681167,419026.2319996517 4577216.795306675))',
	'zoom':{
		'type':'level',
		'zoomLevel':6
	}
}

Highlight(options);

//Highlight a line to geometry center

let options = {
	'geom': 'MULTILINESTRING((418596.62555076234 4577083.383681167,419026.2319996517 4577216.795306675))',
	'zoom':{
		'type':'element'
	}
}

Highlight(options);
DrawGeometry - DEPRECATED
use DrawGeometries
Draws a single geometry, in case you want to draw multiple geometries simultaneusly use DrawGeometries method
E.G.
//Draw a geometry with yellow stroke

const geom = 'MULTILINESTRING((418596.62555076234 4577083.383681167,419026.2319996517 4577216.795306675))'

const style = {
		stroke_color: "rgb(233, 244, 75)"
	}
}

DrawGeometry(geom,style,'sampleName','mockId');
DrawGeometries
Draws geometries
Params
- geoms
<array>:- item
<object>:- geom
<string>- geometry string - style
<object>- stroke_color
<string> - fill_color
<string> - geom_radius
<integer> - stroke_width
<integer> - font_color
<string> - font
<string> - placement
<string> - fontFillColor
<string>- fontStrokeColor
<string>
- fontStrokeColor
- display
<string> - fontStrokeWidth
<integer> - offsetY
<integer> - baseline
<string> - align
<string>
- stroke_color
- name
<string>feauture name - id
<string>feauture id
- geom
- item
E.G.
//Draw a geometry with yellow stroke

const geom = 'MULTILINESTRING((418596.62555076234 4577083.383681167,419026.2319996517 4577216.795306675))'

const style = {
		stroke_color: "rgb(233, 244, 75)"
	}
}
const item = {geom,style,'sampleName','mockId'};
DrawGeometries([item]);
RemoveGeometry
Removes a geometry by ID
Params
- id
<string>- rendered geometry unique - layer
<string>- layer name, optional
E.G.
RemoveGeometry('25', 'somlayer')RemoveGeometriesByProperty
Removes geometries by property value
Params
- layer
<string>- layer name, optional - property
<string>- property name - value - property value
E.G.
RemoveGeometriesByProperty( 'somlayer','type','something')UpdateGeometriesByProperty
Update geometry style based on property value
Params
- layer
<string>- layer name, optional - property
<string>- property name - value - property value
- style
<object>- stroke_color<string>- fill_color<string>- geom_radius<integer>- stroke_width<integer>- font_color<string>- font<string>- placement<string>- fontFillColor<string>- fontStrokeColor<string>- display<string>- fontStrokeWidth<integer>- offsetY<integer>- baseline<string>- align<string>
E.G.
UpdateGeometriesByProperty( 'somlayer','type','something',{
stroke_color: "rgb(255, 0, 0)"}
)
toggleTiled
Deprecated toggleGiswaterTiled
Toggles tiled background (in case tiled background is configured)
Params
- toggle
<boolean>shows/hides tiled background - tiled
<string>tiled background name
E.G.
toggleTiled(true);toggleSecondaryBackground
Toggles secondary background (in case secondary background is configured)
Params
- toggle
<boolean>shows/hides secondary background
E.G.
toggleSecondaryBackground(true);addGeoJSON
Adds geoJSON layer
Params
geoJSON
<geoJSON>geoJSON dataoptions
<json>layer options- fillcolor
<string>fill color. If null will use red color (#ff0000) - strokecolor
<string>strokecolor color. If null will use red color (#ff0000)
- fillcolor
name
<string>geoJson layer name, if null will use a random string
E.G.
addGeoJSON(geoJSON,options, name);


addGeoJSON('GeoJSONContent',{},null);

const options = {
	fillcolor:'#e3ff00',
	strokecolor: '#e3ff00'
}

addGeoJSON('GeoJSONContent', options,'name');
removeGeoJSONLayer
Removes a GeoJSON Layer
removeGeoJSONLayer(layerName);

removeGeoJSONLayer('somename');
clearGeoJSON
Clears geoJSON layer
E.G.
clearGeoJSON(layername);setFilters
Deprecated setGiswaterFilters
Set filters for displayed layers
Filters must be a JSON with valid fields. On Giswater/QGIS projects, available layer filters can be obtained with method getGiswaterLayerAvailableFilters
Each filter must have this format:
- layer_id
- layername -
qgis_nameproperty_ - filters:
- name : field name
- condition :
=,!=,<,>,<=,>=,in,between - value: value to be filtered
- value2: second value, only for
betweenconditions
setFilters(JSON);E.G.
setFilters([
  {
    layer_id: 1,
    layer_name: "mylayer",
    filters: [
      {
        name: 'exp_id',
        condition: 'in',
        value: "'1','4'",
        value2: null
      },
      {
        name: 'status',
        condition: '=',
        value: 'active',
        value2: null
      },
      {
        name: 'anotherField',
        condition: 'between',
        value: '100',
        value2: '200'
      }
    ]
  }
]);
getGiswaterLayerAvailableFilters
Get available WMTS filters for a Giswater layer
getGiswaterLayerAvailableFilters(layername);E.G.
getGiswaterLayerAvailableFilters("Arc");setCustomColors
Sets colors and stroke width for added & highlight geometries.
Properties:
geom_stroke_color- stroke color in RGB formatgeom_fill_color- fill color in RGB formatgeom_stroke_width- stroke width in pixels, default 1.geom_shape- shape por point,circle(default) orsquaregeom_radius- point radius or square side in pixels. Default 4.
setCustomColors({geom_stroke_color, geom_fill_color, geom_stroke_width,geom_shape});E.G.
setCustomColors({
		geom_stroke_color: 'rgb(19, 39, 99,0.5)',
		geom_fill_color: 'rgb(19, 39, 99,0.5)',
    	geom_stroke_width: 1,
    	geom_shape: 'circle',
    	geom_radius: 2
    	});
On Bmaps projects, default values are taken from Backoffice:
geom_stroke_color -> Bmaps: geom_select_stroke_color
geom_fill_color -> Bmaps: geom_select_fill_color
changeBackground
Change background
Properties:
newBackgroud- background name (OSM, google, CartoDBLight,CartoDBDark)
changeBackground('google');initMeasure
Starts measure tools
Properties:
type- measure typelineorareatextStart- helper text to display when tool startstextContinue- helper text to display when tool continues
initMeasure('line','Click for start measuring','Clic for continye measuring`);cancelMeasure
Stop measure tools
cancelMeasure();screenshot
Will do an screenshot of the current map encoded as a PNG in Base64 format. Result will be encapsulated screenshot
screenshot({});Multiple iframes
Is possible to use multiple iframe on a single page, follow this steps.
- Set to your
iframetags the id & value - Add to each
iframe.src&domId=IFRAME_ID - Instantiate each iframe:
var communicator = new VidroMaps.Communicator({
      sessionToken: sessionToken,
      id:'IFRAME_ID'
});
Examples
Simple
examples/simple/
A simple integration with just zoom buttons
How it works
- Gets user, password and API url from the url
- Request a user token to the API
- Loads the first map of the user
https://www.vidrosoftware.com/examples/simple/?user=USER&pwd=USER_PASWORD&api=API_URL
Full
examples/full/
Full integration
How it works
- User, password and API url are defined on the html form
- Stores token and last map loaded in a fake cache
- There's a form for choosing map and customize map parameters
https://www.vidrosoftware.com/examples/full/
Vidromaps
examples/vidromaps/
Vidromaps integration
How it works
- Paste iframe code
https://www.vidrosoftware.com/examples/vidromaps/
Serverless
examples/serveLess/
Server less sample integration
How it works
- Gets user, password and API url from the url
- Request a user token to the API
- Loads the first map of the user with one layer rendered
- On map click, performs an wms info, displays one attribute, highlights the clicked point and centers map on that point
Mutiple iframes
examples/multipleiframes/
Multiple iframes integration
How it works
- Replace
YOUR_SESSION_TOKENwith your session token code on both inputscode1andcode2.
https://www.vidrosoftware.com/examples/multipleiframes/
Known issues
- Custom logo is not displayed
Could be CORS issue. Check the headers sent by your server.
With Apache can be solved with and .htaccess file with this content:
Header set Access-Control-Allow-Origin "*"
Header add Cross-Origin-Resource-Policy: "cross-origin"
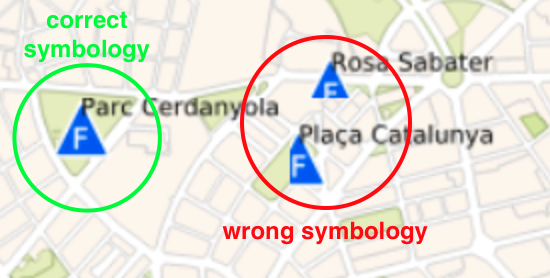
Header add Cross-Origin-Embedder-Policy: "require-corp"- QGIS Broken symbology
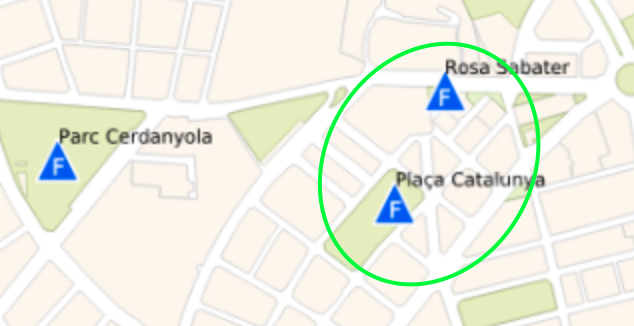
QGIS multi tile layers could show broken symbology:

This can be solved using singletile: true or adding gutter: value in pixels if is a multitiule layer, on toggleLayer method.
Is if is a Giswwater project, you can set this options (Render mode and Gutter) on Bmaps backoffice.

11 months ago
11 months ago
12 months ago
11 months ago
11 months ago
12 months ago
12 months ago
12 months ago
11 months ago
12 months ago
12 months ago
12 months ago
12 months ago
1 year ago
1 year ago
1 year ago
1 year ago
1 year ago
1 year ago
1 year ago
1 year ago
1 year ago
1 year ago
1 year ago
1 year ago
1 year ago
1 year ago
1 year ago
1 year ago
1 year ago
1 year ago
1 year ago
1 year ago
1 year ago
1 year ago
1 year ago
2 years ago
2 years ago
2 years ago
2 years ago
2 years ago
2 years ago
2 years ago
2 years ago
2 years ago
2 years ago
2 years ago
2 years ago
2 years ago
2 years ago
2 years ago
2 years ago
2 years ago
2 years ago
2 years ago
2 years ago
2 years ago
2 years ago
2 years ago
2 years ago
2 years ago
2 years ago
2 years ago
2 years ago
2 years ago
2 years ago
2 years ago
2 years ago
2 years ago
2 years ago
2 years ago
2 years ago
2 years ago
2 years ago
2 years ago
2 years ago
2 years ago
2 years ago
2 years ago
2 years ago
2 years ago
2 years ago
2 years ago
2 years ago
2 years ago
2 years ago
2 years ago
2 years ago
2 years ago
2 years ago
2 years ago
2 years ago
2 years ago
2 years ago
2 years ago
2 years ago
2 years ago
2 years ago
2 years ago
2 years ago
2 years ago
2 years ago
2 years ago
2 years ago
2 years ago
2 years ago
2 years ago
2 years ago
2 years ago
3 years ago
3 years ago
3 years ago
3 years ago
3 years ago
3 years ago
3 years ago
3 years ago
3 years ago
3 years ago
3 years ago
3 years ago
3 years ago
3 years ago
3 years ago
3 years ago
3 years ago
3 years ago
4 years ago
4 years ago
4 years ago
4 years ago
4 years ago
4 years ago
4 years ago
5 years ago
5 years ago
5 years ago
5 years ago
5 years ago
5 years ago