@vii7/awesome-sankey-chart v0.1.21
Sankey Chart
Overview
This repository contains a Sankey chart library, and resources for creating beautiful data visualizations.

Quick Start Example
Here's a simple example using plain vanilla javascripts without any third party dependencies:
<head>
  <title>Sankey Chart Demo</title>

  <script src="../dist/vanilla/event-handler.js"></script>
  <script src="../dist/vanilla/sankey-chart-data.js"></script>
  <script src="../dist/vanilla/sankey-chart.js"></script>
</head>

<body>

  <svg id="sankey-chart-svg" width="900" height="600"></svg>

  <script>
    // Initialize the SankeyChartData with demo data
    const chartData = {
      name: "MockData",
      "nodes": [
        { kind: "product", name: "Product 1" },
        { kind: "product", name: "Product 2", "tags": ["abc"] },
        { kind: "product", name: "Product 3", color: "pink" },
        { kind: "product", name: "Product 4" },
        { kind: "product", name: "Product 5" },
        { kind: "consumer", name: "Consumer 1" },
        { kind: "consumer", name: "Consumer 2" },
        { kind: "consumer", name: "Consumer 3" },
        { kind: "consumer", name: "Consumer 4", "tags": ["xyz"] },
        { kind: "proxy", name: "Proxy A" },
        { kind: "proxy", name: "Proxy B" },
        { kind: "proxy", name: "Proxy C" },
        { kind: "proxy", name: "Proxy D" }
      ],
      "relations": [
        { source: { kind: "consumer", name: "Consumer 1" }, "target": { kind: "product", name: "Product 3" } },
        { source: { kind: "consumer", name: "Consumer 4" }, "target": { kind: "product", name: "Product 3" } },
        { source: { kind: "product", name: "Product 3" }, "target": { kind: "proxy", name: "Proxy B" } },
        { source: { kind: "product", name: "Product 3" }, "target": { kind: "proxy", name: "Proxy A" } },
        { source: { kind: "product", name: "Product 3" }, "target": { kind: "product", name: "Product 4" } },
        { source: { kind: "product", name: "Product 5" }, "target": { kind: "proxy", name: "Proxy A" } },
        { source: { kind: "product", name: "Product 5" }, "target": { kind: "proxy", name: "Proxy B" } },
        { source: { kind: "product", name: "Product 5" }, "target": { kind: "proxy", name: "Proxy C" } },
        { source: { kind: "product", name: "Product 5" }, "target": { kind: "proxy", name: "Proxy D" } },
        { source: { kind: "product", name: "Product 2" }, "target": { kind: "proxy", name: "Proxy D" } }
      ]
    };

    const chartDataOptions = {
      defaultColor: "black",
      kinds: [
        { name: 'consumer', title: 'Consumers' },
        { name: 'product', title: 'Products' },
        { name: 'proxy', title: 'Proxies' }
      ],
      showRelatedKinds: true,
      selectAndFilter: true,
      tagColorMap: {
        "abc": "#ff0000",
        "xyz": "#00ff00"
      }
    };

    const partialData = false;
    const sankeyChartData = new SankeyChartData(chartData, chartDataOptions, partialData);
    sankeyChartData.selectNode({ kind: "product", name: "Product 3" });
    sankeyChartData.selectNode(undefined);

    const svg = document.getElementById('sankey-chart-svg');
    const sankeyChart = new SankeyChart(svg);
    sankeyChart.setData(sankeyChartData);
    sankeyChart.render();

  </script>
</body>
Add Context Menu

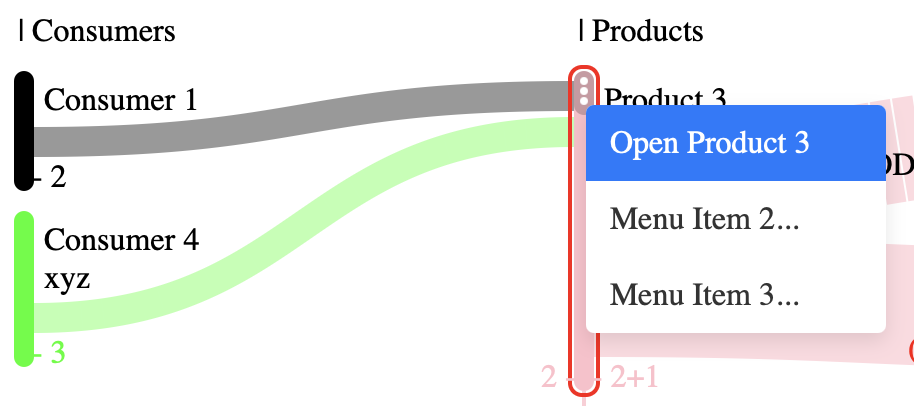
In this section, we demonstrate how to add a custom context menu to the Sankey chart. A context menu provides additional options and actions when a user right-clicks on a selected element within the chart. This can enhance the user experience by offering quick access to relevant features.
Below is an example of how to create and display a context menu using plain HTML, CSS, and JavaScript:
<style>
  .context-menu {
    position: absolute;
    top: 50px;
    left: 0;
    background-color: white;
    box-shadow: 0 4px 10px rgba(0, 0, 0, 0.1);
    border-radius: 4px;
    overflow: hidden;
    display: none;
    width: 150px;
    z-index: 1000;
  }

  .context-menu ul {
    list-style: none;
    margin: 0;
    padding: 0;
  }

  .context-menu .menu-item {
    padding: 10px 12px;
    cursor: pointer;
    transition: background-color 0.3s ease;
    font-size: 1em;
    color: #333;
  }

  .context-menu .menu-item:hover {
    background-color: #007bff;
    color: white;
  }
</style>

<div id="contextMenu" class="context-menu"></div>
<script>
const sankeyChartData = new SankeyChartData(chartData, chartDataOptions);
sankeyChartData.selectNode({ kind: "product", name: "Product 3" });
sankeyChartData.selectNode(undefined);
const svg = document.getElementById('sankey-chart-svg');
const sankeyChart = new SankeyChart(svg);
sankeyChart.setData(sankeyChartData);
sankeyChart.render();
/* Add Context Menu */
const contextMenu = document.getElementById("sankey-chart-contextMenu");
function populateContextMenu(event, selectedNode) {
contextMenu.innerHTML = "";
contextMenu.style.display = "block";
contextMenu.style.left = `${event.pageX}px`;
contextMenu.style.top = `${event.pageY}px`;
const items = [
{
label: "Open " + selectedNode.name,
url: "https://example.com/item1",
target: "same"
},
{ label: "Menu Item 2...", url: "https://example.com/item2" },
{ label: "Menu Item 3...", url: "https://example.com/item3" }
];
const list = document.createElement("ul");
contextMenu.appendChild(list);
// Add new menu items
items.forEach((item) => {
const menuItem = document.createElement("li");
menuItem.classList.add("menu-item");
menuItem.textContent = item.label;
menuItem.addEventListener("click", (event) => {
alert(`You clicked on ${item.label}`);
list.style.display = "none";
});
list.appendChild(menuItem);
});
return items;
}
sankeyChart.addContextMenuListeners(populateContextMenu);
// Close menu if clicked outside
document.addEventListener("click", (event) => {
contextMenu.style.display = "none";
});
</script>Add Minimap

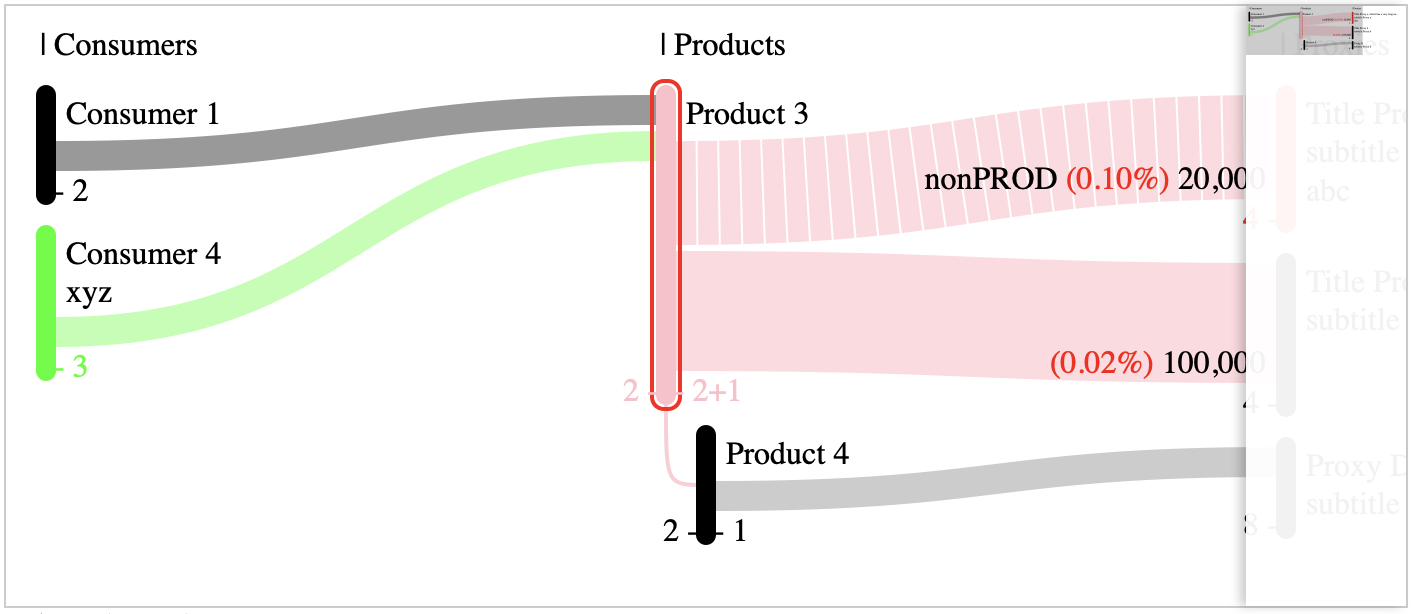
In this section, we demonstrate how to add a minimap to the Sankey chart. A minimap provides an overview of the entire chart, allowing users to navigate large charts more easily.
Below is an example of how to create and display a minimap using plain HTML, CSS, and JavaScript:
<style>
  .minimap-container {
    display: flex;
    position: relative;
    width: 400px;
    height: 300px;
    border: 1px solid #ccc;
  }

  .minimap-viewport {
    overflow: auto;
  }

  .minimap-viewport::-webkit-scrollbar {
    display: none;
  }

  .minimap-pane {
    width: 80px;
    box-shadow: -3px 0 5px -4px black;
    background-color: rgba(255, 255, 255, 0.9);
    backdrop-filter: blur(3px);
  }

  .minimap-visible-section {
    fill: rgba(0, 0, 0, 0.2);
  }
</style>
<div id="container" class="minimap-container">
  <!-- Main Viewport -->
  <div id="mainViewport" class="minimap-viewport">
    <svg id="sankey-chart-svg"><!-- Add your SVG content here --></svg>
  </div>
</div>
<script src="../dist/vanilla/minimap.js"></script>
<script>
const svgElement = document.getElementById('sankey-chart-svg');
const containerElement = document.getElementById('container');
const mainViewElement = document.getElementById('mainViewport');
new Minimap(svgElement, containerElement, mainViewElement);
</script>CDN
11 months ago
11 months ago
11 months ago
12 months ago
12 months ago
1 year ago
1 year ago
1 year ago
1 year ago
1 year ago
1 year ago
1 year ago
1 year ago
1 year ago
1 year ago
1 year ago
1 year ago
1 year ago
1 year ago
1 year ago