2.0.9 • Published 6 months ago
a-sdl-app-component v2.0.9
a-sdl-app-component
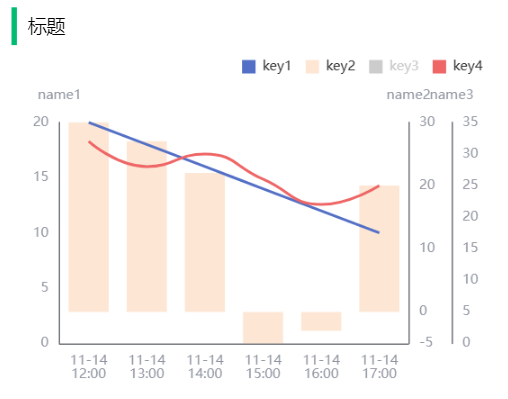
由 HUESDL 团队移动端项目孵化的组件库,组件包括<AsyncDataEcharts>、<SdlCard>、<DataTags>、<DataTable>,以满足团队移动端部分需求,实现代码复用;其中<AsyncDataEcharts>支持通过 Props 渲染多 Y 轴且支持 Y 轴复用的 Echarts 图表,支持单独配置每个数据的展示类型(折线、柱状)、最大最小值、默认选中状态、颜色;未接收到数据时会显示加载中动画,提升用户体验,用法见快速上手。
GitHub: https://github.com/Z-404-Not-Found/a-sdl-app-component
npm: https://www.npmjs.com/package/a-sdl-app-component
安装
npm install a-sdl-app-component

// or

yarn add a-sdl-app-component

// or

pnpm add a-sdl-app-component
为减小打包后的大小,echarts 作为外部依赖,使用本组件库前,需要在项目中安装 echarts。
快速上手
引入
// main.js or main.ts
import { createApp } from "vue";
import { createPinia } from "pinia";
import App from "./App.vue";
import router from "./router";

import { SDLAppCom } from "a-sdl-app-component"; // 引入组件
import "a-sdl-app-component/dist/style.css"; // 引入样式

const app = createApp(App);

app.use(createPinia());

app.use(SDLAppCom); // 注册组件

app.use(router);

app.mount("#app");
特别注意:如果项目使用 TypeScript,则需要在 env.d.ts 添加如下代码
declare module "a-sdl-app-component";使用
AsyncDataEcharts——异步加载 echarts
封装异步 Echarts 组件,搭配 Vue 异步组件展示加载动画提升用户体验,通过 Props 渲染多 Y 轴且支持 Y 轴复用的图表,支持单独配置每个数据的展示类型(折线、柱状)、最大最小值、默认选中状态、颜色。
说明
| 属性 | 说明 | 类型 | 是否必需 | 默认值 |
|---|---|---|---|---|
| echartsResData | 数据查询接口响应,格式见 echartsResData 初始值 | object[] | 与 dataMap 二选一 | 无 |
| nameList | 需要显示在 echarts 中数据字段的 key 值,需包含在 echartsResData 或 dataMap 中,形如"key1","key2","key3","key4" | string[] | Y | 无 |
| indexList | 控制哪些数据字段显示在同一 y 轴上,与 nameList 中的值一一对应,形如0,1,1,2,表示 key1 数据字段单独显示在一个 y 轴,key2,key3 一起显示在第二个 y 轴,key4 显示在第三个 y 轴,数字需逐渐递增 | number[] | Y | 无 |
| yAxisNameList | 各 y 轴的名字,形如'name1','name2','name2','name3',表示 key1 所在的 y 轴名为 name1 , key2,key3 所在的 y 轴名为 name2, key4 所在的 y 轴名为 name3,与 indexList 对应 | string[] | Y | 无 |
| selectList | 控制数据字段是否默认选中,形如true,true,false,true,表示默认选中 key1、 key2、key4,key3 默认不选中 ;为空即默认全部选中 | boolean[] | N | 无 |
| lineList | 控制数据字段是否为柱状图,形如true,false,true,true,表示 key1、 key3、key4 为折线图,key2 为柱状图 ;为空即默认全部是折线图 | boolean[] | N | 无 |
| maxMinList | 控制数据字段的最大最小值,与 nameList 一一对应,形如['','',-2,2,-5,5,'',''] ,表示 key1,key4 不设定最大最小值,key2 显示的最小值为-2,最大值为 2,key3 显示的最小值为-5,最大值为 5;为空则全部不设置最大最小值 | array[] | N | 无 |
| colorList | 设置数据字段显示在图中的颜色,可为 16 进制色值或 rgb、rgba 色值,为空则为 echarts 默认颜色 | string[] | N | 无 |
| dataMap | 如果 后端返回的数据格式有变化,则不能使用 echartsResData 属性,需在外部将数据格式化为 map,通过该属性传入组件,该 map 包含一个 time 键,该键的值为字符串数组,是数据字段在 x 轴对应的时间,其他键需要将 nameList 中存在的数据字段全部包含,数据键的值为数字数组,数组长度需要与 time 键的值中数组的长度一致并一一对应 | map | 与 echartsResData 二选一 | 无 |
<template>
    <SdlCard>
        <template #content>
            <AsyncDataEcharts
                :echartsResData="echartsResData"
                :nameList="nameList"
                :indexList="indexList"
                :yAxisNameList="yAxisNameList"
                :selectList="selectList"
                :lineList="lineList"
                :maxMinList="maxMinList"
                :colorList="colorList"
            ></AsyncDataEcharts>
        </template>
    </SdlCard>
</template>

<script setup>
import { onMounted, ref } from "vue";
const echartsResData = ref();
const nameList = ["key1", "key2", "key3", "key4"];
const indexList = [0, 1, 1, 2];
const yAxisNameList = ["name1", "name2", "name2", "name3"];
const selectList = [true, true, false, true];
const lineList = [true, false, true, true];
const maxMinList = [
    ["", ""],
    [-5, 30],
    [-5, 25],
    ["", ""],
];
const colorList = ["#5470c6", "rgba(242,137, 42, 0.2)", "#FF33A1", "#ee6666"];

onMounted(() => {
    echartsResData.value = [
        {
            createTime: "2024-11-14 17:00:00",
            data: [
                { key: "key1", value: 10 },
                { key: "key2", value: 20 },
                { key: "key3", value: 15 },
                { key: "key4", value: 25 },
                { key: "key5", value: 30 },
            ],
        },
        {
            createTime: "2024-11-14 16:00:00",
            data: [
                { key: "key1", value: 12 },
                { key: "key2", value: -3 },
                { key: "key3", value: 17 },
                { key: "key4", value: 22 },
                { key: "key5", value: 28 },
            ],
        },
        {
            createTime: "2024-11-14 15:00:00",
            data: [
                { key: "key1", value: 14 },
                { key: "key2", value: -10 },
                { key: "key3", value: 19 },
                { key: "key4", value: 26 },
                { key: "key5", value: 33 },
            ],
        },
        {
            createTime: "2024-11-14 14:00:00",
            data: [
                { key: "key1", value: 16 },
                { key: "key2", value: 22 },
                { key: "key3", value: 21 },
                { key: "key4", value: 30 },
                { key: "key5", value: 35 },
            ],
        },
        {
            createTime: "2024-11-14 13:00:00",
            data: [
                { key: "key1", value: 18 },
                { key: "key2", value: 27 },
                { key: "key3", value: 24 },
                { key: "key4", value: 28 },
                { key: "key5", value: 40 },
            ],
        },
        {
            createTime: "2024-11-14 12:00:00",
            data: [
                { key: "key1", value: 20 },
                { key: "key2", value: 30 },
                { key: "key3", value: 22 },
                { key: "key4", value: 32 },
                { key: "key5", value: 42 },
            ],
        },
    ];
});
</script>
// 在echartsResData格式如上面定义时,dataMap生成方法如下,显示效果与上面一样

import { ref } from "vue";
const dataMap = ref(new Map());
import moment from "moment";

const echartsResData = [
    {
        createTime: "2024-11-14 17:00:00",
        data: [
            { key: "key1", value: 10 },
            { key: "key2", value: 20 },
            { key: "key3", value: 15 },
            { key: "key4", value: 25 },
            { key: "key5", value: 30 },
        ],
    },
    {
        createTime: "2024-11-14 16:00:00",
        data: [
            { key: "key1", value: 12 },
            { key: "key2", value: -3 },
            { key: "key3", value: 17 },
            { key: "key4", value: 22 },
            { key: "key5", value: 28 },
        ],
    },
    {
        createTime: "2024-11-14 15:00:00",
        data: [
            { key: "key1", value: 14 },
            { key: "key2", value: -10 },
            { key: "key3", value: 19 },
            { key: "key4", value: 26 },
            { key: "key5", value: 33 },
        ],
    },
    {
        createTime: "2024-11-14 14:00:00",
        data: [
            { key: "key1", value: 16 },
            { key: "key2", value: 22 },
            { key: "key3", value: 21 },
            { key: "key4", value: 30 },
            { key: "key5", value: 35 },
        ],
    },
    {
        createTime: "2024-11-14 13:00:00",
        data: [
            { key: "key1", value: 18 },
            { key: "key2", value: 27 },
            { key: "key3", value: 24 },
            { key: "key4", value: 28 },
            { key: "key5", value: 40 },
        ],
    },
    {
        createTime: "2024-11-14 12:00:00",
        data: [
            { key: "key1", value: 20 },
            { key: "key2", value: 30 },
            { key: "key3", value: 22 },
            { key: "key4", value: 32 },
            { key: "key5", value: 42 },
        ],
    },
];

const nameList = ["key1", "key2", "key3", "key4"];

const processResData = (echartsData, nameList) => {
    let data = echartsData;
    let map = new Map();
    nameList.forEach((item) => {
        map.set(item, []);
    });
    map.set("time", []);
    for (let i = data.length - 1; i >= 0; i--) {
        let dataCur = data[i].data;
        map.get("time").push(
            moment(data[i].createTime).format("MM-DD HH:mm").replace(" ", "\n")
        );
        dataCur.forEach((item) => {
            if (map.has(item.key)) {
                map.get(item.key).push(Number(item.value));
            }
        });
    }
    return map;
};

// 该函数可根据情况灵活定义,并在收到后端响应数据后调用
dataMap.value = processResData(echartsResData, nameList);
dataMap.value 此时的值为,如果使用 dataMap prop 时,dataMap 示例值如下:
Map(5) {
  'key1' => [ 20, 18, 16, 14, 12, 10 ],
  'key2' => [ 30, 27, 22, -10, -3, 20 ],
  'key3' => [ 22, 24, 21, 19, 17, 15 ],
  'key4' => [ 32, 28, 30, 26, 22, 25 ],
  'time' => [
    '11-14\n12:00',
    '11-14\n13:00',
    '11-14\n14:00',
    '11-14\n15:00',
    '11-14\n16:00',
    '11-14\n17:00'
  ]
}
DataTable——数据表格
说明
| 属性 | 说明 | 类型 | 是否必需 | 默认值 |
|---|---|---|---|---|
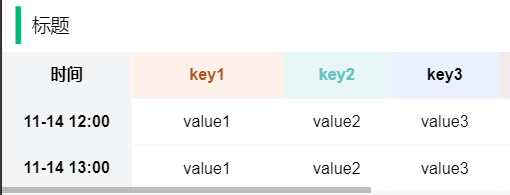
| tableHead | 表头,一个包含 key 的对象数组,只会显示包含在 tableHead 中的列,格式见 tableHead 默认值 | object[] | N | 见下方 tableHead 默认值 |
| tableData | 表格数据,对象数组,格式见 tableHead 默认值 | object[] | N | 见下方 tableData 默认值 |
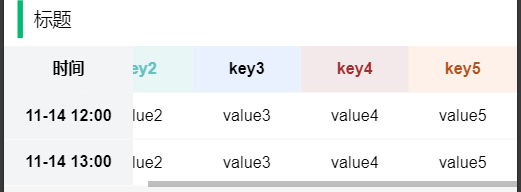
| largeCol | 除时间外大宽度列的表头 key 数组,为空则宽度全部为 5rem,包含在 largeCol 数组中的表头 key 宽度为 7rem | string[] | N | 见下方 largeCol 默认值 |
// tableHead 默认值
const tableHead = [
    { key: "key1" },
    { key: "key2" },
    { key: "key3" },
    { key: "key4" },
    { key: "key5" },
];
// tableData 默认值
const tableData = [
    {
        createTime: "2024-11-14 12:00:00",
        data: [
            { key: "key1", value: "value1" },
            { key: "key2", value: "value2" },
            { key: "key3", value: "value3" },
            { key: "key4", value: "value4" },
            { key: "key5", value: "value5" },
            { key: "key6", value: "value6" },
        ],
    },
    {
        createTime: "2024-11-14 13:00:00",
        data: [
            { key: "key1", value: "value1" },
            { key: "key2", value: "value2" },
            { key: "key3", value: "value3" },
            { key: "key4", value: "value4" },
            { key: "key5", value: "value5" },
            { key: "key6", value: "value6" },
        ],
    },
]
// largeCol 默认值
const largeCol = ["key1"],
示例
<template>
    <SdlCard title="标题">
        <template #content>
            <DataTable
                :tableData="tableData"
                :tableHead="tableHead"
                :largeCol="largeCol"
            ></DataTable>
        </template>
    </SdlCard>
</template>
<script setup>
const tableHead = [
    { key: "key1" },
    { key: "key2" },
    { key: "key3" },
    { key: "key4" },
    { key: "key5" },
];
const tableData = [
    {
        createTime: "2024-11-14 12:00:00",
        data: [
            { key: "key1", value: "value1" },
            { key: "key2", value: "value2" },
            { key: "key3", value: "value3" },
            { key: "key4", value: "value4" },
            { key: "key5", value: "value5" },
            { key: "key6", value: "value6" },
        ],
    },
    {
        createTime: "2024-11-14 13:00:00",
        data: [
            { key: "key1", value: "value1" },
            { key: "key2", value: "value2" },
            { key: "key3", value: "value3" },
            { key: "key4", value: "value4" },
            { key: "key5", value: "value5" },
            { key: "key6", value: "value6" },
        ],
    },
];
const largeCol = ["key1"];
</script>

特别说明
在实际项目中,
<DataTable>大部分时间会和 vant 组件库中的<van-list>一起使用以实现下拉刷新,具体实现代码如下
<template>
    <van-list
        v-model:loading="loading"
        :finished="finished"
        @load="onLoad"
        :offset="100"
        :finished-text="'没有更多了'"
        :loading-text="'加载中...'"
    >
        <DataTable
            :tableData="tableData"
            :tableHead="tableHead"
            :largeCol="['key1', 'key2', 'key3', 'key4', 'key5']"
        ></DataTable>
    </van-list>
</template>
<script setup lang="ts">
import { ref } from "vue";

const tableData = ref<any>([]);
const tableHead = ref<any>([]);

let size = 30;
const loading = ref(false);
const finished = ref(false);

const getData = async () => {
    // getData中的API请求时异步的,也就是前面需要加await,并在函数中声明async,如果不是异步,会出现连续请求的情况
    await yourDataAPI({
        page: "1",
        size: size.toString(),
    }).then((res) => {
        if (res.data.data != null) {
            tableHead.value = res.data.data[0].data;
            tableData.value = res.data.data;
        }
        if (res.data.count < size) {
            finished.value = true;
        } else {
            finished.value = false;
        }
    });
};
const onLoad = async () => {
    loading.value = true;
    size = size + 30;
    // showToast({ message: "加载中...", duration: 0, position: "bottom" });

    await getData(); // !!!很重要,这里需要加await,否则会出现连续请求的情况,和getData()方法定义的异步请求配合使用

    // closeToast();
    if (finished.value) {
        // showToast({
        //     message: "没有更多了",
        //     duration: 1000,
        //     position: "bottom",
        // });
    }
    loading.value = false;
};
</script>
SdlCard——卡片
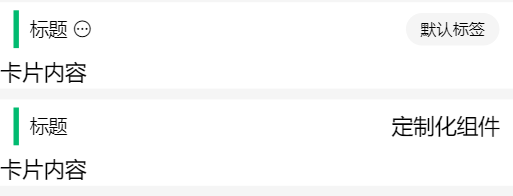
HUESDL 团队设计的卡片组件,可定制化标题和标签右侧内容(默认为灰色 tag),支持内容插槽和标题部分右侧插槽。
说明
| 属性 | 说明 | 类型 | 是否必需 | 默认值 |
|---|---|---|---|---|
| title | 标题 | string | N | --- |
| 插槽 | 说明 |
|---|---|
| content | 卡片内容 |
| rightTag | 卡片标题右侧默认标签,用于显示字符串(不可与 customRight 同时存在) |
| customRight | 定制化标题右侧内容,插入用于实现特殊需求的组件 |
| titleIcon | 标题右侧图标 |
示例
<template>
    <SdlCard title="标题">
        <template #titleIcon>
            <!-- 标题右侧图标 -->
            <van-icon name="more-o" @click="showElectricityPrice = true" />
        </template>
        <template #rightTag>
            <!-- 默认右侧标签显示内容 -->
            默认标签
        </template>
        <template #content>
            <!-- 卡片内容 -->
            卡片内容
        </template>
    </SdlCard>

    <!-- or -->

    <SdlCard title="标题">
        <template #customRight>
            <!-- 定制化标题右侧内容,可以插入用于实现特殊需求的组件 -->
            定制化组件
        </template>
        <template #content>
            <!-- 卡片内容 -->
            卡片内容
        </template>
    </SdlCard>
</template>
DataTags——数据标签
说明
| 属性 | 说明 | 类型 | 是否必需 | 默认值 |
|---|---|---|---|---|
| dataTags | 标签内容,需传入一个对象数组,key-value 格式,详见默认值格式 | object[] | N | 见下方 dataTags 默认值 |
// dataTags默认值
const dataTags = [
    {
        key: "key1",
        value: "value1",
    },
    {
        key: "key2",
        value: "value2",
    },
],
示例
<template>
    <SdlCard title="标题">
        <template #content>
            <DataTags :dataTags="dataTags"></DataTags>
        </template>
    </SdlCard>
</template>
<script setup>
const dataTags = [
    {
        key: "key1",
        value: "value1",
    },
    {
        key: "key2",
        value: "value2",
    },
];
</script>