Angular Org Chart
An Angular 15+ library for displaying Organization charts. It's a very lightweight library with the features currently not available in any other library. It's written in pure typescript and is developed focussing on Angular projects Now the name of the package is misguiding, but no point crying over spilled milk, the other names were taken.
Getting Started
For using the chart, you'll need to do the following steps:
Installation
npm install angular13-organization-chart --saveAdd the dependency in module
Add OrgChartModule in imports
import { BrowserModule } from '@angular/platform-browser';
import { NgModule } from '@angular/core';
import { OrgChartModule } from 'angular13-organization-chart';
import { AppComponent } from './app.component';

@NgModule({
  declarations: [
    AppComponent
  ],
  imports: [
    BrowserModule,
    OrgChartModule // << this module
  ],
  providers: [],
  bootstrap: [AppComponent]
})
export class AppModule { }
Formatting the data in component
The data requires few parameters for displaying the correct chart:
export interface TreeNode {
    // Node
    children: TreeNode[];
    hideChildren?: boolean;
    onClick?: () => void;
    // CSS (used for custom styling of individual nodes)
    cssClass?: string;
    css?: string;
}
For example I want my nodes to have a name, a description, and an image:
// make your own interface that extends TreeNode
interface MyTreeNode extends TreeNode {
    name: string;
    description?: string;
    image?: string;
    children: MyTreeNode[];
}
Example:
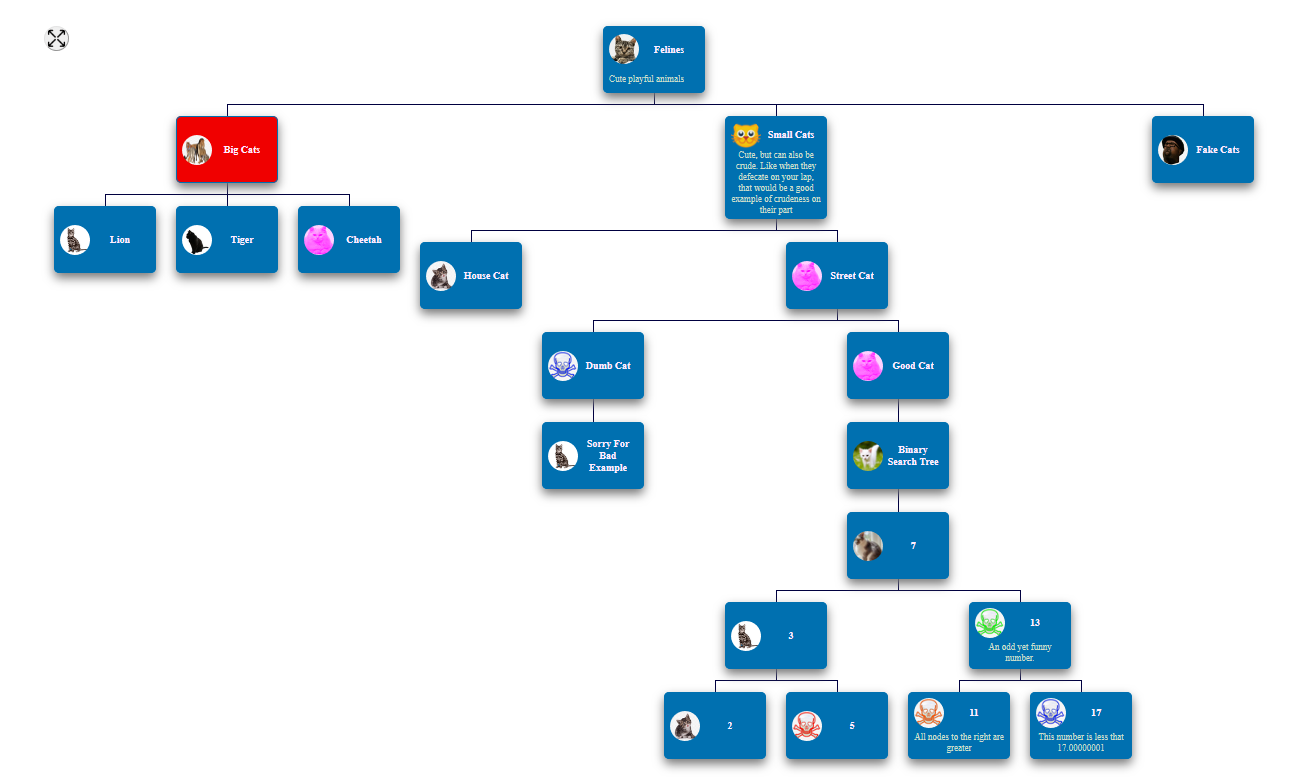

Code:
Typescript
tree: MyTreeNode = {
    name: 'Felines',
    description: 'Cute playful animals',
    image: 'assets/chart-images/1.png',
    onClick: () => alert('Death to dogs'),
    children: [
      {
        name: 'Big Cats',
        image: 'assets/chart-images/3.jpg',
        css: 'background-color: #F00000',
        children: [
          {
            name: 'Lion',
            image: 'assets/chart-images/6.png',
            children: []
          },
          {
            name: 'Tiger',
            cssClass: 'yellow-on-hover',
            image: 'assets/chart-images/4.jpg',
            children: []
          },
          {
            name: 'Cheetah',
            image: 'assets/chart-images/8.png',
            children: []
          }
        ]
      },
      {
        name: 'Small Cats',
        description: 'Cute, but can also be crude. Like when they defecate on your lap, that would be a good example of crudeness on their part',
        image: 'assets/chart-images/9.png',
        children: [
          {
            name: 'House Cat',
            image: 'assets/chart-images/7.png',
            children: []
          },
          {
            name: 'Street Cat',
            image: 'assets/chart-images/8.png',
            children: [
              {
                name: 'Dumb Cat',
                image: 'assets/chart-images/13.png',
                children: [
                  {
                    name: 'Sorry For Bad Example',
                    image: 'assets/chart-images/6.png',
                    children: []
                  }
                ],
              },
              {
                name: 'Good Cat',
                image: 'assets/chart-images/8.png',
                children: [
                  {
                    name: 'Binary Search Tree',
                    image: 'assets/chart-images/10.png',
                    children: [
                      {
                        name: '7',
                        image: 'assets/chart-images/11.png',
                        children: [
                          {
                            name: '3',
                            image: 'assets/chart-images/6.png',
                            children: [
                              {
                                name: '2',
                                image: 'assets/chart-images/7.png',
                                children: []
                              },
                              {
                                name: '5',
                                image: 'assets/chart-images/12.png',
                                children: []
                              }
                            ]
                          },
                          {
                            name: '13',
                            description: 'An odd yet funny number.',
                            image: 'assets/chart-images/14.png',
                            children: [
                              {
                                name: '11',
                                description: 'All nodes to the right are greater',
                                image: 'assets/chart-images/15.png',
                                children: []
                              },
                              {
                                name: '17',
                                image: 'assets/chart-images/13.png',
                                description: 'This number is less that 17.00000001',
                                children: []
                              }
                            ]
                          }
                        ]
                      }
                    ]
                  }
                ]
              }
            ]
          }
        ]
      },
      {
        name: 'Fake Cats',
        image: 'assets/chart-images/5.png',
        children: [],
        onClick: () => console.log('Google chrome stole some RAM')
      }
    ]
  };
HTML
<angular-org-chart [nodeTemplate]="nodeTemplate" [data]="tree" #exampleChart="orgChart">

    <!-- OPTIONAL: zoom button with an ugly png -->
    <button zoom-button class="zoom-button" (click)="exampleChart.toggleZoom()">
        <img src="assets/zoom-in-out.png" width="100%" alt="ZoomInOut">
    </button>

</angular-org-chart>

<!-- Node Template -->
<ng-template #nodeTemplate let-node>
    <div class="chart-node">
        <img [src]="node?.image">
        <div class="name">{{node?.name}}</div>
        <div class="description">{{node?.description}} </div>
        <!-- An ugly button to fold/unfold -->
        <div *ngIf="node.children.length" (click)="node.hideChildren = !node.hideChildren" class="tree-fold-btn">{{node.hideChildren ? '+' : '-'}}</div>
    </div>
</ng-template>
CSS
:host {
    display: block;
    text-align: center;
    padding: 64px;
}

// ugly css for quick test, use your own!
.zoom-button {
    padding: 0;
    margin: 0;
    border-radius: 50%;
    text-align: center;
    width: 40px;
    height: 40px;
    overflow: hidden;
}
See Full Example On Github
Customizing CSS
encapsulation: ViewEncapsulation.None
Encapsulation is disabled, So... go crazy. Here is the style sheet, you can find all the classes here.
- PS: To style a single node you can use the optional fields in OrgData.
Features
- OnClick callback
- Custom Angular-Templates for nodes
- Custom styles for individual nodes
- Maintained and lightweight code
- Zoom to see the overview, and hove on nodes to expand them
- Supports folding/unfolding
Authors
- Shrey Kumar Jain - Original Author
- MuaazH - Contributed to the problem