animated-3d-piechart v0.0.5
Animeted 3d piechart
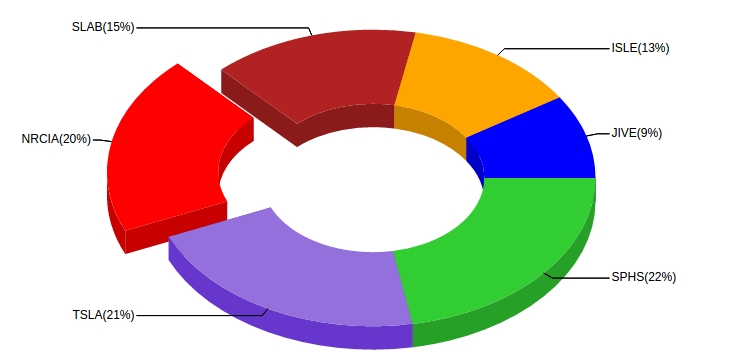
This library is for drawing nice looking pie/donat charts with d3js.
Here is the link to the demo
##How to install
npm install animeted-3d-piechart
How to use it
In you html file you need to add any html tag with uniq id.
Example:
<div id="piechart"></div>
And add script:
import Dounat3D from 'animated-3d-pie';

var chartId = 'piechart';
var data = [10, 20, 30];
piechart3D.draw(chartId, data);
piechart3D.draw(chartid, data, config')
chartId- string, id of html that where chart should be placeddata- array of numbers or objectsconfig- object with chart config
Data
Data can be provided on two ways. The basic one is an array of numbers - example [10, 20, 30]. Each number will be treat as value for single part of the chart. Colors will be added automatic for each value.
Second way is to provide own array of objects with definitions of colors and/or lables.
Data with objects:
var data = [
  {
    value: 10,
      color: 'red',
      label: 'No'
  },
  {
    value: 20,
      color: 'green',
      label: 'Yes'
  },
  {
    value: 5,
      color: 'silver',
      label: 'Others'
  }
];value- numbercolor- stringlabel- string
Config
config - Object
| Parameter | Default | Decryption |
|---|---|---|
ir | 0 | Number (min: 0, max: 100) Inner radius in % |
h | 20 | Number (min: 0) Height of walls in px |
angle | 45 | Number (min: 0, max: 90) Angle of chart in degrees, when 90 the chart become normal flat pie chart |
size | 100 | Number (min: 0, max: 100) size in inner html tag in % |
animationDuration | 750 | Number (min: 0) time in ms of drawing the chart |
fontSize | 12 | Number (min: 0) label and tooltip font size in px |
animatedSlices | true | Boolean if false the slices are not click-able |
label | labelFunction | Function/Boolean if false there will be no labels on the chart, d => {} |
linesColor | 'black' | Function/String color for the lines, d => {} |
labelColor | 'black' | Function/String color for the lables, d => {} |
onSliceSelect | null | Function on slice click, d => {} |
tooltip | tooltipFunction | Function tooltip text, d => {} |
tooltipColor | black | Function/String color of the tooltips, d => {} |
d => {} - function that depends on d.
d = {
  data: {
      color: ...,
        value: ...,
        label: ...
    },
    index: ...,
    startAngle: ...,
    endAngle: ...,
    value: ...
}
Example of function d => {}:
tooltipFunction: d => `${Number(d.value).toFixed(2)}`Update
Update chart if config or data changed.
piechart3D.update(chartId, data, config)
License
MIT License 2016 © woles