0.0.5-alpha • Published 2 years ago
antdv-charts-table v0.0.5-alpha
antdv-charts-table
About
Charts and table switch components, you can switch between chart and table.
Prerequests
echarts > 5.0.0, ant-design-vue for vue 3.
Project setup
Install
npm i -S antdv-charts-tableUseage
src/main.ts
import { createApp } from 'vue'
import App from './App.vue'
import Antd from 'ant-design-vue'
import AntdvChartsTable from 'antdv-charts-table'
import 'ant-design-vue/dist/antd.css'
import 'antdv-charts-table/dist/style.css'

const app = createApp(App)
app.use(Antd)
app.use(AntdvChartsTable)

app.mount('#app')
For type bar demo
<template>
  <div>
    <div style="width: 60%; margin: 0 auto;">
      <act-table-chart :option="barChartOptions"></act-table-chart>
    </div>
  </div>
</template>
<script lang="ts">
import { defineComponent } from 'vue';
import Mock from 'mockjs';
import { toolUtil } from '../../utils/toolUtils';

export default defineComponent({
  name: 'BarChartPage',
  data() {
    const mockData = Mock.mock({
      'result|12': [{
        'statsDate|+1': 202101,
        'totalCount|7000-9000': 9000,
        'successCount|3000-7000': 7000,
        'sucRate': '50%',
      }]
    });
    // Table columns
    const barColumns = [
      {
        title: '序号',
        width: 70,
        dataIndex: '',
        customRender: (item) => {
          return item.index + 1;
        }
      },
      {
        title: '时间',
        dataIndex: 'statsDate',
      },
      {
        title: '调用总数',
        dataIndex: 'totalCount',
        customRender: (item) => toolUtil.commafy(item.text),
      },
      {
        title: '成功数',
        dataIndex: 'successCount',
        customRender: (item) => toolUtil.commafy(item.text),
      },
      {
        title: '成功率',
        dataIndex: 'sucRate',
        customRender: (item) => `${((item.record.successCount / item.record.totalCount) * 100).toFixed(2)}%`,
      },
    ];
    return {
      barChartOptions: {
        title: '柱状图demo',
        type: 'bar',
        data: mockData.result,
        columns: barColumns,
        toolBar: true,
        keyName: 'statsDate',
        valueName: ['successCount', 'totalCount'],
        name: ['成功数', '总数'],
        barColor: ['#52c41a', '#7687a1'],
        xRotate: 45,
        toolTipFormatter: (params: any) => {
          // console.log(params);
          let res = `时间:${params[0].name}`;
          res += `<br/>${params[0].marker} ${params[0].seriesName}:${toolUtil.commafy(params[0].value)}`;
          res += `<br/>${params[1].marker} ${params[1].seriesName}:${toolUtil.commafy(params[1].value)}`;
          // res += `<br/>失败次数:${toolUtil.commafy(params[0].data.originalData.failCount)}`;
          res += `<br/>成功率:${(params[0].value * 100 / params[1].value).toFixed(2)}%`;
          return res;
        },
        xAxisFormatter: (value: any) => value,
        yAxisName: '数量',
        yAxisFormatter: (value: any) => toolUtil.commafy(value),
        loading: false,
      },
    };
  },
});
</script>
Page view
For type bar and show type chart
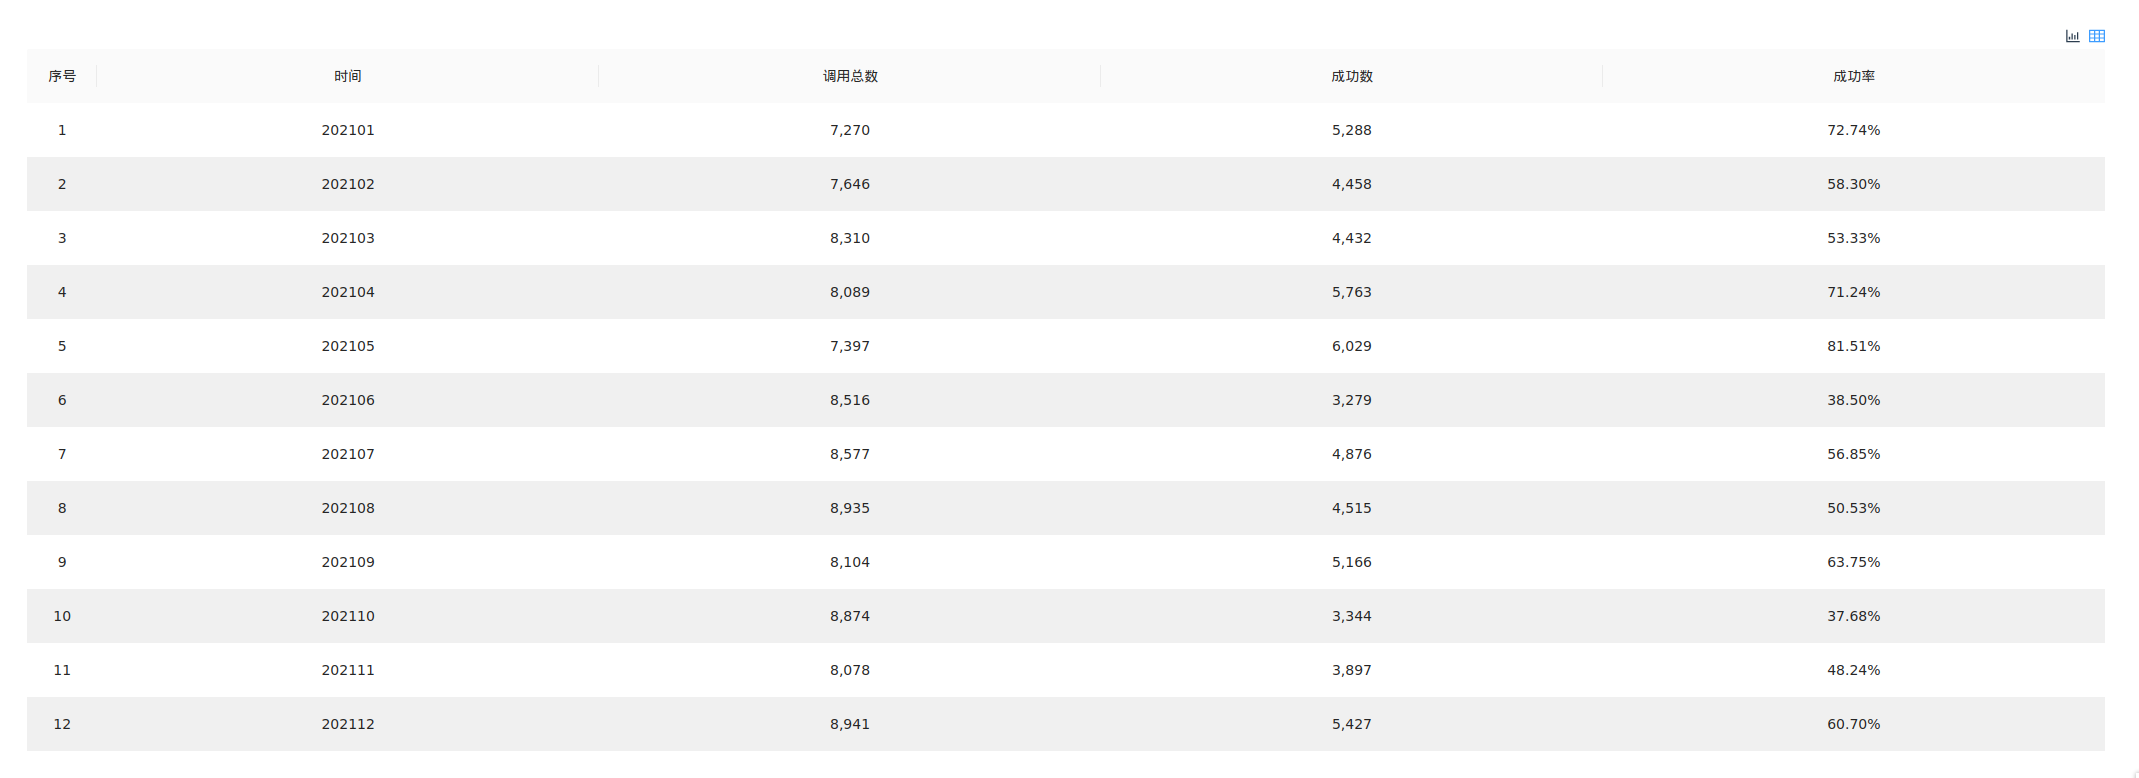
 For type bar and switch to table

Configuration docs
0.0.5-alpha
2 years ago
0.0.4-alpha
3 years ago
0.0.2-alpha
3 years ago
0.0.3-alpha
3 years ago
0.0.1-alpha
3 years ago