1.0.2 • Published 3 years ago
basicwebglplot v1.0.2
Simple WebGL 2D Plotting

- PROS: Extremely basic
- ~10 kB unpacked size
- 1 single function
buildPlotWebGL
- CONS: cannot be used for any detailed/scientific plotting
- No axes
- No labels
Installation
npm install basicwebglplotUsage
- An example react app that uses this library
import React from 'react';
import { useEffect, useRef } from 'react';
import {buildPlotWebGL, DrawModeGL} from 'basicwebglplot';

function App() {
  const refContainer = useRef<null | HTMLCanvasElement>(null);
  useEffect(()=>{
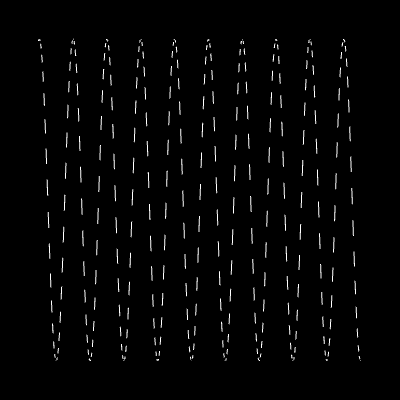
    buildPlotWebGL(refContainer.current as HTMLCanvasElement ,Math.sin,-30,30,0.1,DrawModeGL.LINES,400,400)
  },[refContainer])

  return (
    <div >
      <canvas ref={refContainer} width="500" height="500"></canvas>
    </div>
  );
}

export default App;
And here is an example without typescript
import React from 'react';
import { useEffect, useRef } from 'react';
import {buildPlotWebGL, DrawModeGL} from 'basicwebglplot';

function App() {
  const refContainer = useRef(null);
  useEffect(()=>{
    buildPlotWebGL(refContainer.current ,Math.sin,-30,30,0.1,DrawModeGL.LINES,400,400)
  },[refContainer])

  return (
    <div >
      <canvas ref={refContainer} width="500" height="500"></canvas>
    </div>
  );
}

export default App;
Development
Making typedocs
npm run cleandocs
npm run docs #builds typedoc docs
npm run viewdocs #view docs locally
Running storybook
npm run storybookExport storybook as static page
npm run build-storybook