1.3.0 • Published 11 years ago
canvas-chart v1.3.0
Canvas chart
Takes an array of data points, makes a canvas of it and save as a PNG
Installation
npm install canvas-chart --save-dev
Graph types
The implemented graph types
- Line
Standard settings
{
    filename: 'public/out',
    grid: true,
    height: 450,
    lineWidth: 3,
    points: true,
    pointFill: '#fff',
    pointStroke: '#000',
    stroke: true,
    strokeColor: '#000',
    type: 'line',
    width: 800
}
Use
  var chart = require('canvas-chart');
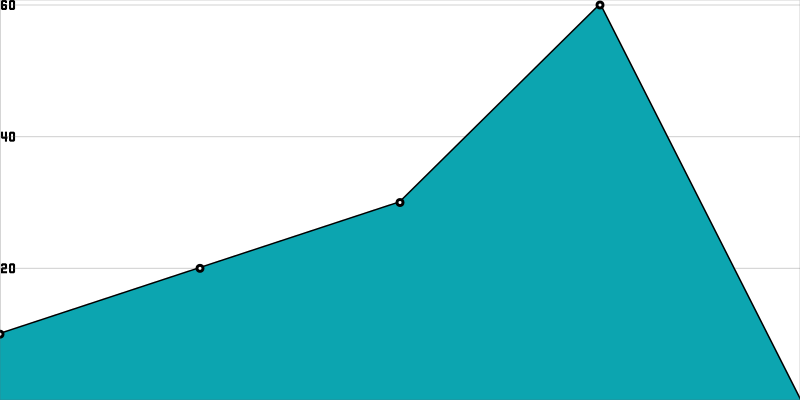
  var data = [10, 20, 30, 60];

  chart.graph(data, {
    filename: 'movies',
    fillColor: 'rgba(12, 165, 176, 1)'
  });
This writes a .png at public/movies.png that looks like this:
