chartjs-chart-sankey
Chart.js ^3.3 module for creating sankey diagrams
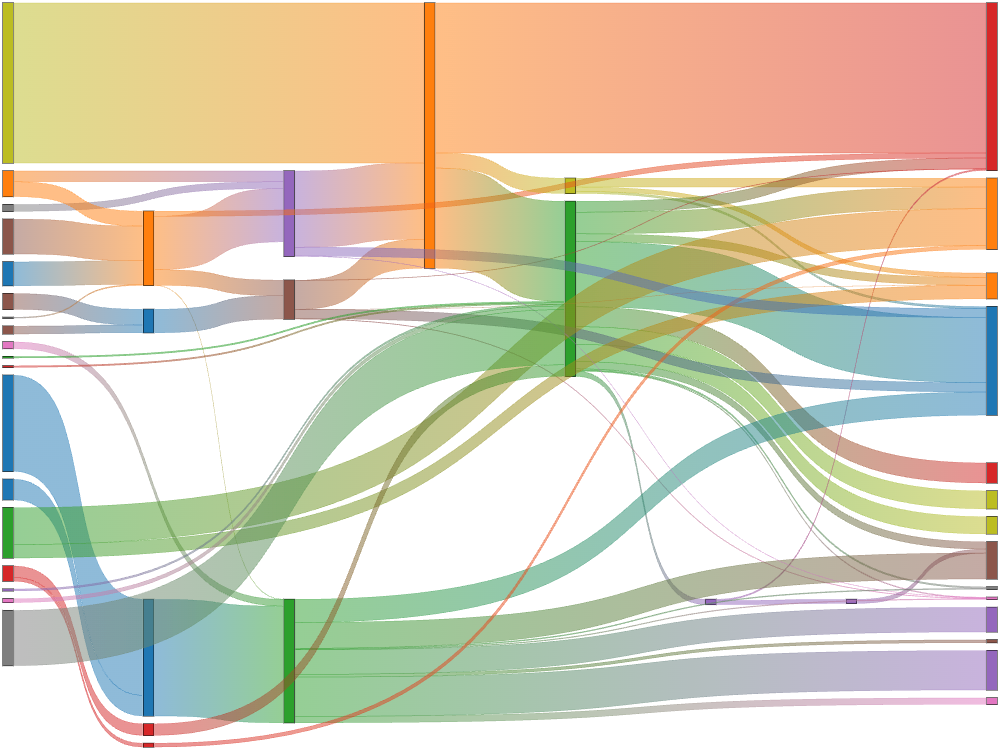
![]()


Browser support
All modern and up-to-date browsers are supported, including, but not limited to:
- Chrome
- Edge
- Firefox
- Safari
Internet Explorer 11 is not supported.
Typescript
Typescript 3.x and higher is supported.
Documentation
You can find documentation for chartjs-chart-sankey at https://chartjs-chart-sankey.pages.dev/.
Integration
You can use chartjs-chart-sankey.js as ES module. You'll need to manually register two components
import {Chart} from 'chart.js';
import {SankeyController, Flow} from 'chartjs-chart-sankey';

Chart.register(SankeyController, Flow);
For script tag usage, load the browser bundle after Chart.js. The browser bundle registers the sankey controller and flow element automatically.
<script src="https://cdn.jsdelivr.net/npm/chart.js"></script>
<script src="https://cdn.jsdelivr.net/npm/chartjs-chart-sankey"></script>
The same bundle can be loaded from UNPKG:
<script src="https://unpkg.com/chart.js"></script>
<script src="https://unpkg.com/chartjs-chart-sankey"></script>
If a CDN does not use the package metadata for its default file, reference the browser bundle directly:
<script src="https://cdn.jsdelivr.net/npm/chartjs-chart-sankey/dist/chartjs-chart-sankey.min.js"></script>To create a sankey chart, include chartjs-chart-sankey.js after chart.js and then create the chart by setting the type
attribute to 'sankey'
const chart = new Chart(ctx, {
  type: 'sankey',
  data: dataObject
});
Configuration
Example:
const colors = {
  a: 'red',
  b: 'green',
  c: 'blue',
  d: 'gray'
};

const getHover = (key) => colors[key];
const getColor = (key) => colors[key];

const chart = new Chart(ctx, {
  type: 'sankey',
  data: {
    datasets: [{
      label: 'My sankey',
      data: [
        {from: 'a', to: 'b', flow: 10},
        {from: 'a', to: 'c', flow: 5},
        {from: 'b', to: 'c', flow: 10},
        {from: 'd', to: 'c', flow: 7}
      ],
      colorFrom: (c) => getColor(c.dataset.data[c.dataIndex].from),
      colorTo: (c) => getColor(c.dataset.data[c.dataIndex].to),
      hoverColorFrom: (c) => getHover(c.dataset.data[c.dataIndex].from),
      hoverColorTo: (c) => getHover(c.dataset.data[c.dataIndex].to),
      colorMode: 'gradient', // or 'from' or 'to'
      /* optionally override default alpha (0.5) applied to colorFrom and colorTo */
      alpha: 1,
      /* optional labels */
      labels: {
        a: 'Label A',
        b: 'Label B',
        c: 'Label C',
        d: 'Label D'
      },
      /* optional priority */
      priority: {
        b: 1,
        d: 0
      },
      /* optional column overrides */
      column: {
        d: 1
      },
      size: 'max', // or 'min' if flow overlap is preferred
    }]
  },
});
Custom data structure
Custom data structure can be used by specifying the custom data keys in options.parsing.
For example:
const chart = new Chart(ctx, {
  type: 'sankey',
  data: {
    datasets: [
      {
        data: [
          {source: 'a', destination: 'b', value: 20},
          {source: 'c', destination: 'd', value: 10},
          {source: 'c', destination: 'e', value: 5},
        ],
        colorFrom: 'red',
        colorTo: 'green'
      }
    ]
  },
  options: {
    parsing: {
      from: 'source',
      to: 'destination',
      flow: 'value'
    }
  }
});
Example
Online examples
Development
You first need to install node dependencies (requires Node.js):
> npm installThe following commands will then be available from the repository root:
> npm run build         // build dist files
> npm run autobuild     // build and watch for changes
> npm test              // run all tests
> npm autotest          // run all tests and watch for changes
> npm lint              // perform code linting
> npm package           // create an archive with dist files and samples
License
chartjs-chart-sankey is available under the MIT license.