Chart.js Venn and Euler Diagram Chart
![]()
![]()
Chart.js module for charting venn diagrams with up to five sets. Adding new chart type: venn and euler.
Related Plugins
Check out also my other chart.js plugins:
- chartjs-chart-boxplot for rendering boxplots and violin plots
- chartjs-chart-error-bars for rendering errors bars to bars and line charts
- chartjs-chart-geo for rendering map, bubble maps, and choropleth charts
- chartjs-chart-graph for rendering graphs, trees, and networks
- chartjs-chart-pcp for rendering parallel coordinate plots
- chartjs-chart-wordcloud for rendering word clouds
- chartjs-plugin-hierarchical for rendering hierarchical categorical axes which can be expanded and collapsed
Install
npm install --save chart.js chartjs-chart-vennUsage
see Examples
or at this
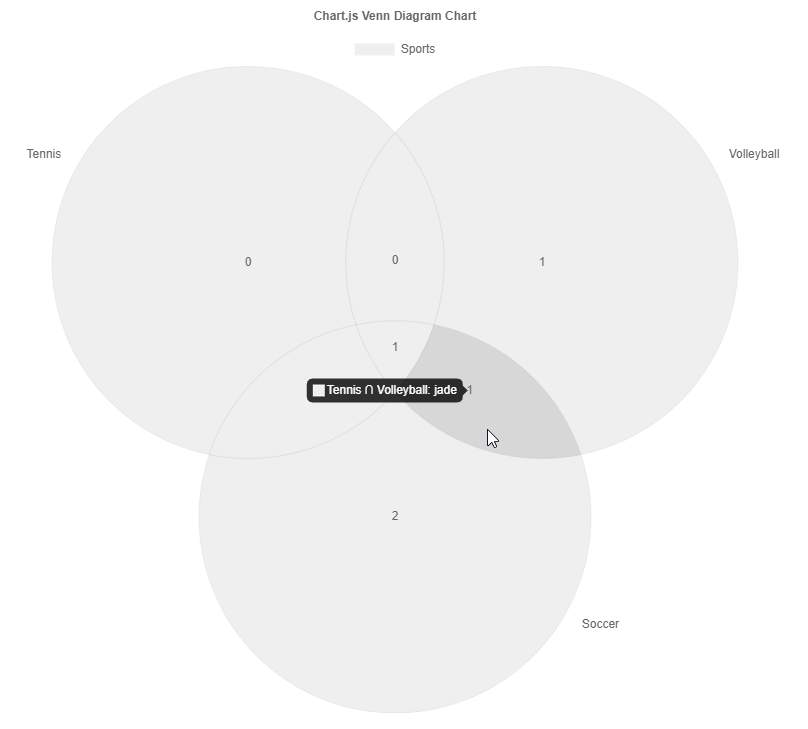
Venn Diagram
Data Structure
const config = {
  type: 'venn',
  data: ChartVenn.extractSets(
    [
      { label: 'Soccer', values: ['alex', 'casey', 'drew', 'hunter'] },
      { label: 'Tennis', values: ['casey', 'drew', 'jade'] },
      { label: 'Volleyball', values: ['drew', 'glen', 'jade'] },
    ],
    {
      label: 'Sports',
    }
  ),
  options: {},
};
Alternative data structure
const config = {
  type: 'venn',
  data: {
    labels: [
      'Soccer',
      'Tennis',
      'Volleyball',
      'Soccer ∩ Tennis',
      'Soccer ∩ Volleyball',
      'Tennis ∩ Volleyball',
      'Soccer ∩ Tennis ∩ Volleyball',
    ],
    datasets: [
      {
        label: 'Sports',
        data: [
          { sets: ['Soccer'], value: 2 },
          { sets: ['Tennis'], value: 0 },
          { sets: ['Volleyball'], value: 1 },
          { sets: ['Soccer', 'Tennis'], value: 1 },
          { sets: ['Soccer', 'Volleyball'], value: 0 },
          { sets: ['Tennis', 'Volleyball'], value: 1 },
          { sets: ['Soccer', 'Tennis', 'Volleyball'], value: 1 },
        ],
      },
    ],
  },
  options: {},
};
Styling of elements
ArcSlice elements have the basic backgroundColor, borderColor, and borderWidth properties similar to a regular rectangle.
Styling of labels
The x scale ticks options are used to configure the set value labels within the intersections.
The y scale ticks options are used to configure the set label labels next ot the set circles.
Changing the tick display options (e.g. scales.x.ticks.display = false) will disable the set value labels.
Similarly, its font spec and color are used to the styling of the labels.
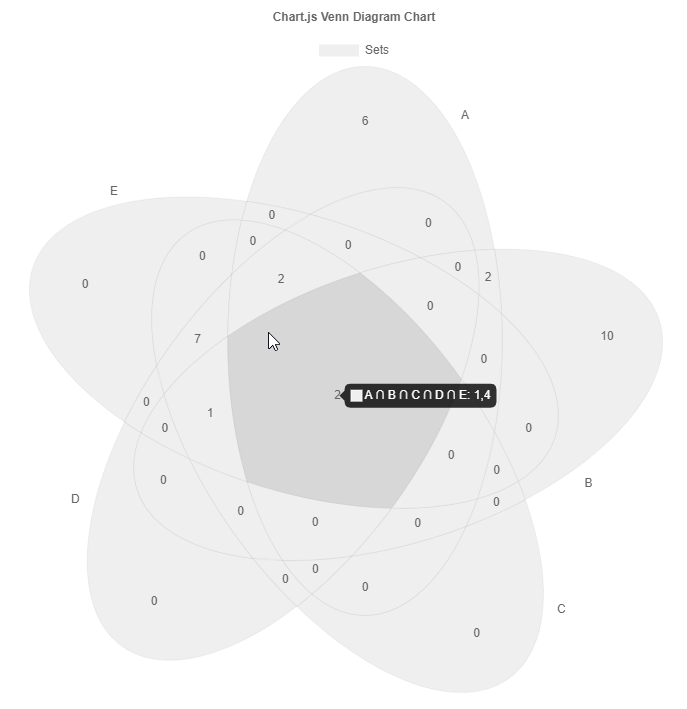
Euler Diagram
Euler diagrams are relaxed proportional venn diagrams such that the area of the circles and overlap try to fit the overlapping value. It is a relaxed in a way that is just approximates the proportions using a numerical optimization process. Moreover, only one and two set overlaps are used for the computation. The library uses venn.js in the background.
Data Structure
const config = {
  type: 'euler',
  data: ChartVenn.extractSets(
    [
      { label: 'A', values: [1, 2, 3, 4, 11, 12, 13, 14, 15, 16, 17, 18] },
      { label: 'B', values: [1, 2, 3, 4, 5, 6, 7, 8, 9, 10, 19, 20, 21, 22, 23] },
      { label: 'C', values: [1, 11, 12, 4, 5, 24, 25, 26, 27, 28, 29, 30] },
    ],
    {
      label: 'Sets',
    }
  ),
  options: {},
};
Styling of elements
see Venn Diagram
ESM and Tree Shaking
The ESM build of the library supports tree shaking thus having no side effects. As a consequence the chart.js library won't be automatically manipulated nor new controllers automatically registered. One has to manually import and register them.
Variant A:
import { Chart, LinearScale } from 'chart.js';
import { VennDiagramController, ArcSlice } from 'chartjs-chart-venn';

Chart.register(VennDiagramController, ArcSlice, LinearScale);
...

new Chart(ctx, {
  type: VennDiagramController.id,
  data: [...],
});
Variant B:
import { VennDiagramChart } from 'chartjs-chart-venn';

new VennDiagramChart(ctx, {
  data: [...],
});
Development Environment
npm i -g yarn
yarn install
yarn sdks vscode
Common commands
yarn compile
yarn test
yarn lint
yarn fix
yarn build
yarn docs