1.0.0 • Published 6 years ago
charts-3d v1.0.0
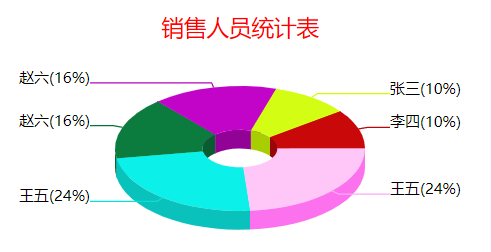
Charts-3d
本库基于 d3js 二次开发而成,主要解决市面上对 3d 图表欠缺问题。目前仅为 pie 图的支持,其它后续补充。
##安装
npm install charts-3d
##使用
添加一个具有 id 属性的 dom 元素,并为其设定 css 的宽和高
<div id="pie"></div>
#pie {
  width: 400px;
  height: 300px;
}
支持 commonjs 和 umd 开发模式
一、Vue 框架
import 'd3';
import Charts3d from 'charts-3d';
export default {
  data() {
    return {
      opts: {
        select: '#pie',
        title: {
          text: '销售人员统计表',
          fontSize: '18px',
          color: 'red',
          top: 40
        },
        fontSize: '12px',
        angle: 45,
        deep: 15
      },
      data: [
        {
          id: 1,
          title: '张三',
          value: 12
        },
        {
          id: 2,
          title: '李四',
          value: 12
        },
        {
          id: 3,
          title: '王五',
          value: 28
        },
        {
          id: 4,
          title: '赵六',
          value: 19
        },
        {
          id: 5,
          title: '王五',
          value: 28
        },
        {
          id: 6,
          title: '赵六',
          value: 19
        }
      ]
    };
  },
  mounted() {
    this.pie = Charts3d.init(this.opts);
    setTimeout(() => {
      this.pie.update(this.data);
    }, 100);
  },
  methods: {
    update() {
      this.data.forEach(item => {
        item.value = 1 + Math.round(Math.random() * (100 - 1));
      });
      const temp = this.data.filter(item => item.value > 20);
      this.pie.update(temp);
    }
  }
};
二、umd
const data = [
  {
    id: 1,
    title: '张三',
    value: 12
  },
  {
    id: 2,
    title: '李四',
    value: 12
  },
  {
    id: 3,
    title: '王五',
    value: 28
  },
  {
    id: 4,
    title: '赵六',
    value: 19
  },
  {
    id: 5,
    title: '王五',
    value: 28
  },
  {
    id: 6,
    title: '赵六',
    value: 19
  }
];

const opt = {
  select: '#pie',
  title: {
    text: '销售人员统计表',
    fontSize: '18px',
    color: 'red',
    top: 40
  },
  fontSize: '12px',
  angle: 45,
  deep: 15
};
// const pieChart = new Charts3D(opt);
const pieChart = Charts3D.init(opt);
setTimeout(() => {
  pieChart.update(data);
}, 100);
function update() {
  data.forEach(item => {
    item.value = 1 + Math.round(Math.random() * (100 - 1));
  });
  const temp = data.filter(item => item.value > 20);
  pieChart.update(temp);
}
Charts3d.init(this.opts)
this.opts- Array, 初始化饼图的参数
说明
opts - Object
{
    title: {
        text: '',
        top: 0,
        fontSize: '14px',
        color: 'red'
    }, // 标题
    deep: 20, // (最小值:0)以px为单位的饼厚度
    angle: 45, // 最小值:0,最大值:90)图表的角度,以度为单位,当90成为正常的平面饼图
    ir: 0.3, // (最小值:0,最大值:1)内空心占饼比例
    size: 100, // 相对于用户元素的大小 %
    fontSize: '12px', // 字号(px)
    colors: {
        pies: ['#d3fe14', '#c9080a', '#fec7f8', '#0b7b3e', '#0bf0e9', '#c203c8', '#fd9b39', '#888593'],
        label: ''
    },
    animationDuration: 700, // 动画时长
    // onSliceSelect: null,
    labelText: d => {
      return `${d.data.title}(${Math.round(((d.endAngle - d.startAngle) / (2 * Math.PI)) * 100)}%)`;
    }
};
Update
更新饼图数据
pie.update(data, opts)
License
MIT License 2020 © 8013685@qq.com
1.0.0-beta.1
6 years ago
1.0.1-beta.0
6 years ago
1.0.0-beta.0
6 years ago
1.0.1
6 years ago
1.0.0
6 years ago