chartscii v3.0.1
Chartscii 3.0!
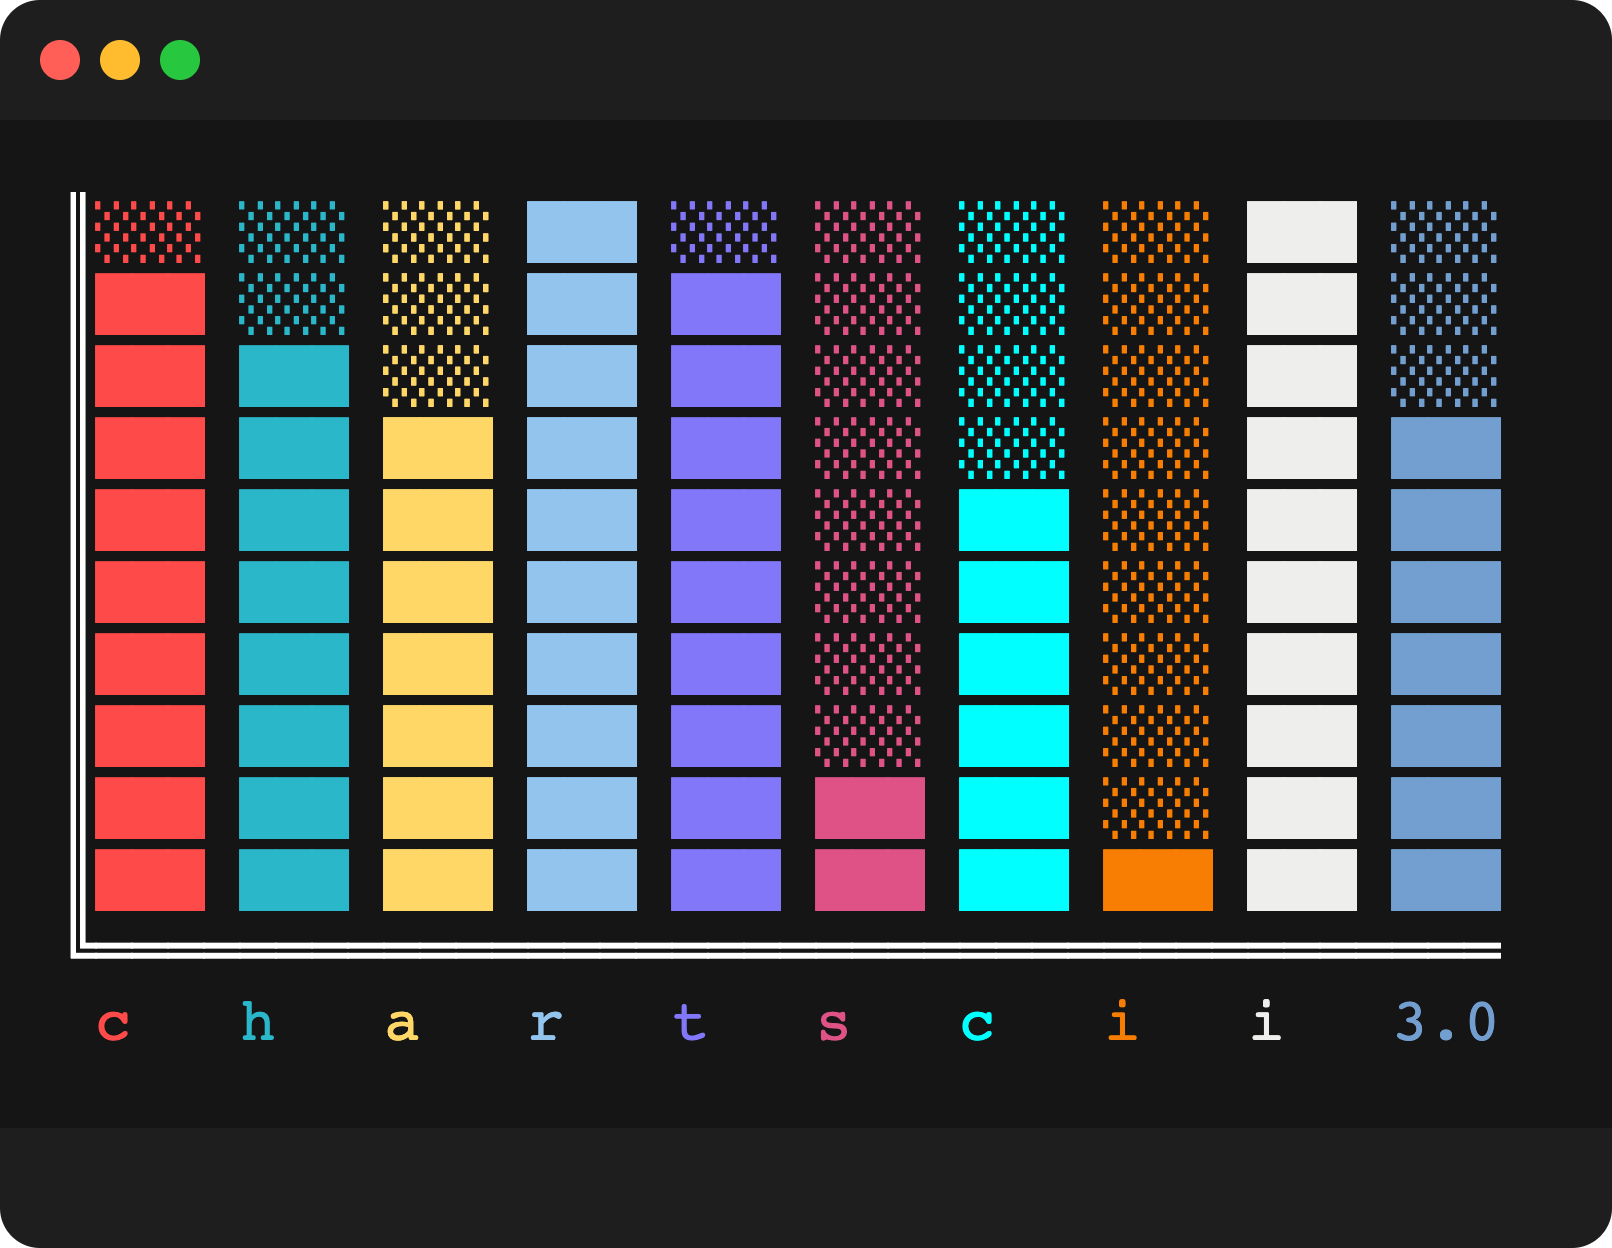
for command line usage see: chartscii-cli
Chartscii was rewritten from scratch in TypeScript! It includes many new features, improvements and rich formatting capabilities.
What’s new
✅ Full width and height control.
✅ New padding and barSize options!
✅ New orientation option! vertical charts are here!
✅ New rich styl3 formatting support!
✅ New Emoji characters support! *
install
npm install chartsciiusage
chartscii accepts an array of data objects, with optional labels, and outputs an ascii bar chart.
usage example
import Chartscii from "chartscii";

const data = [1, 2, 3, 4, 5, 6, 7, 8, 9, 10];
const options = {
  title: "chartscii",
  width: 50,
  theme: "pastel",
  color: "pink",
  colorLabels: true,
  barSize: 2,
  orientation: "vertical"
};
const chart = new Chartscii(data, options);
console.log(char.create());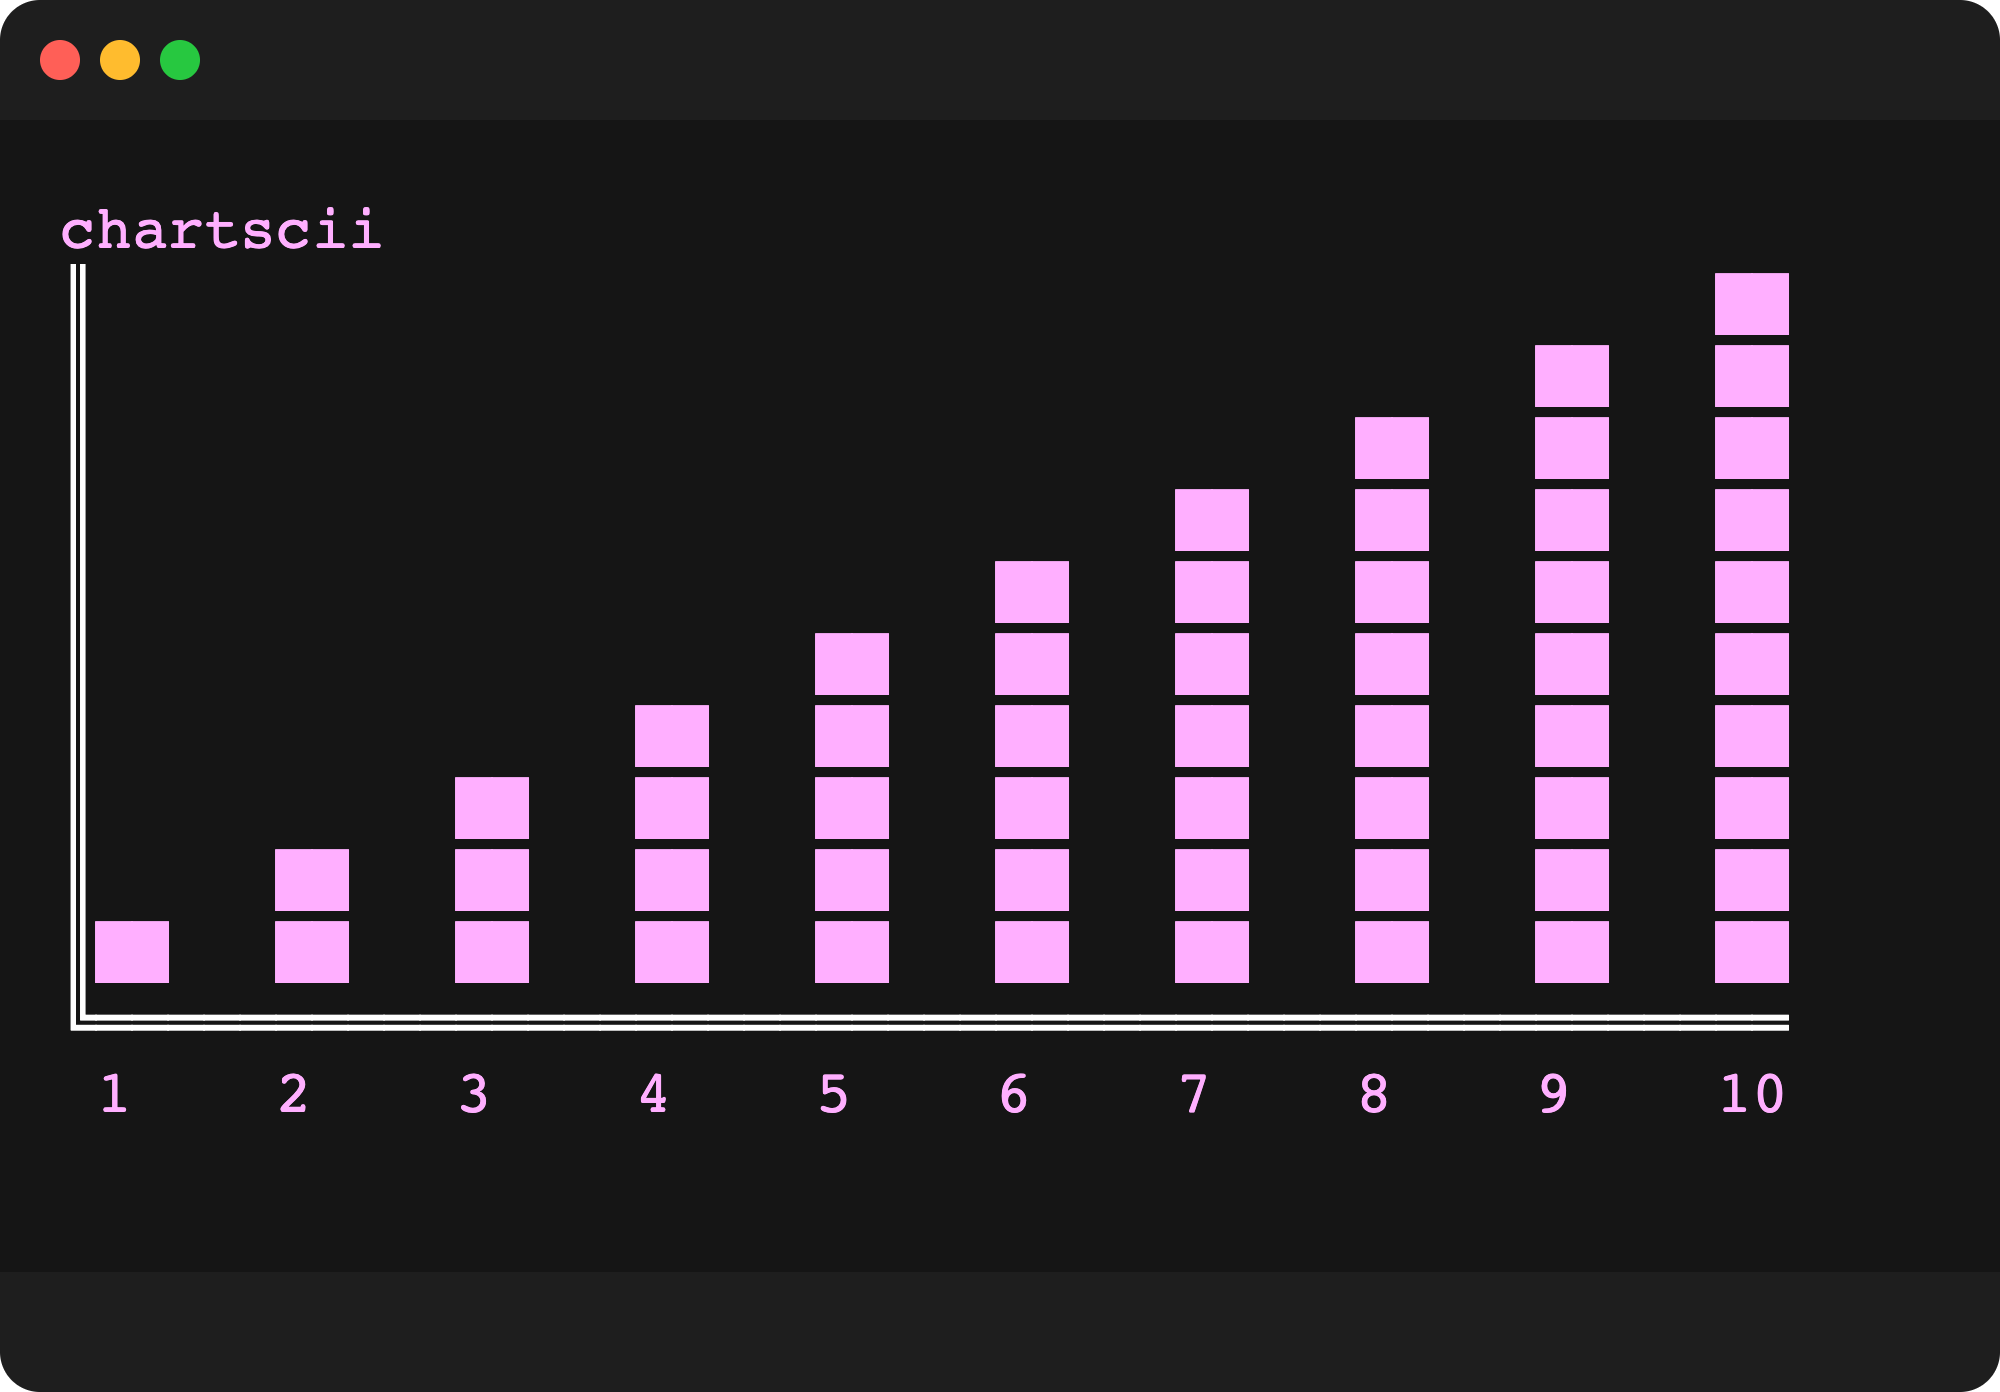
Input
Chartscii accepts an array of data points to draw the chart.
This can be an array of numbers, or an array of chart points as explained below.
number[]
If you provide an array of numbers, chartscii will draw each bar using the provided values.
Value is scaled to width/height of chart, depending on the orientation option.
example
import Chartscii from "chartscii";

const data = [1, 2, 3, 4, 5, 6, 7, 8, 9, 10];
const chart = new Chartscii(data);
console.log(chart.create());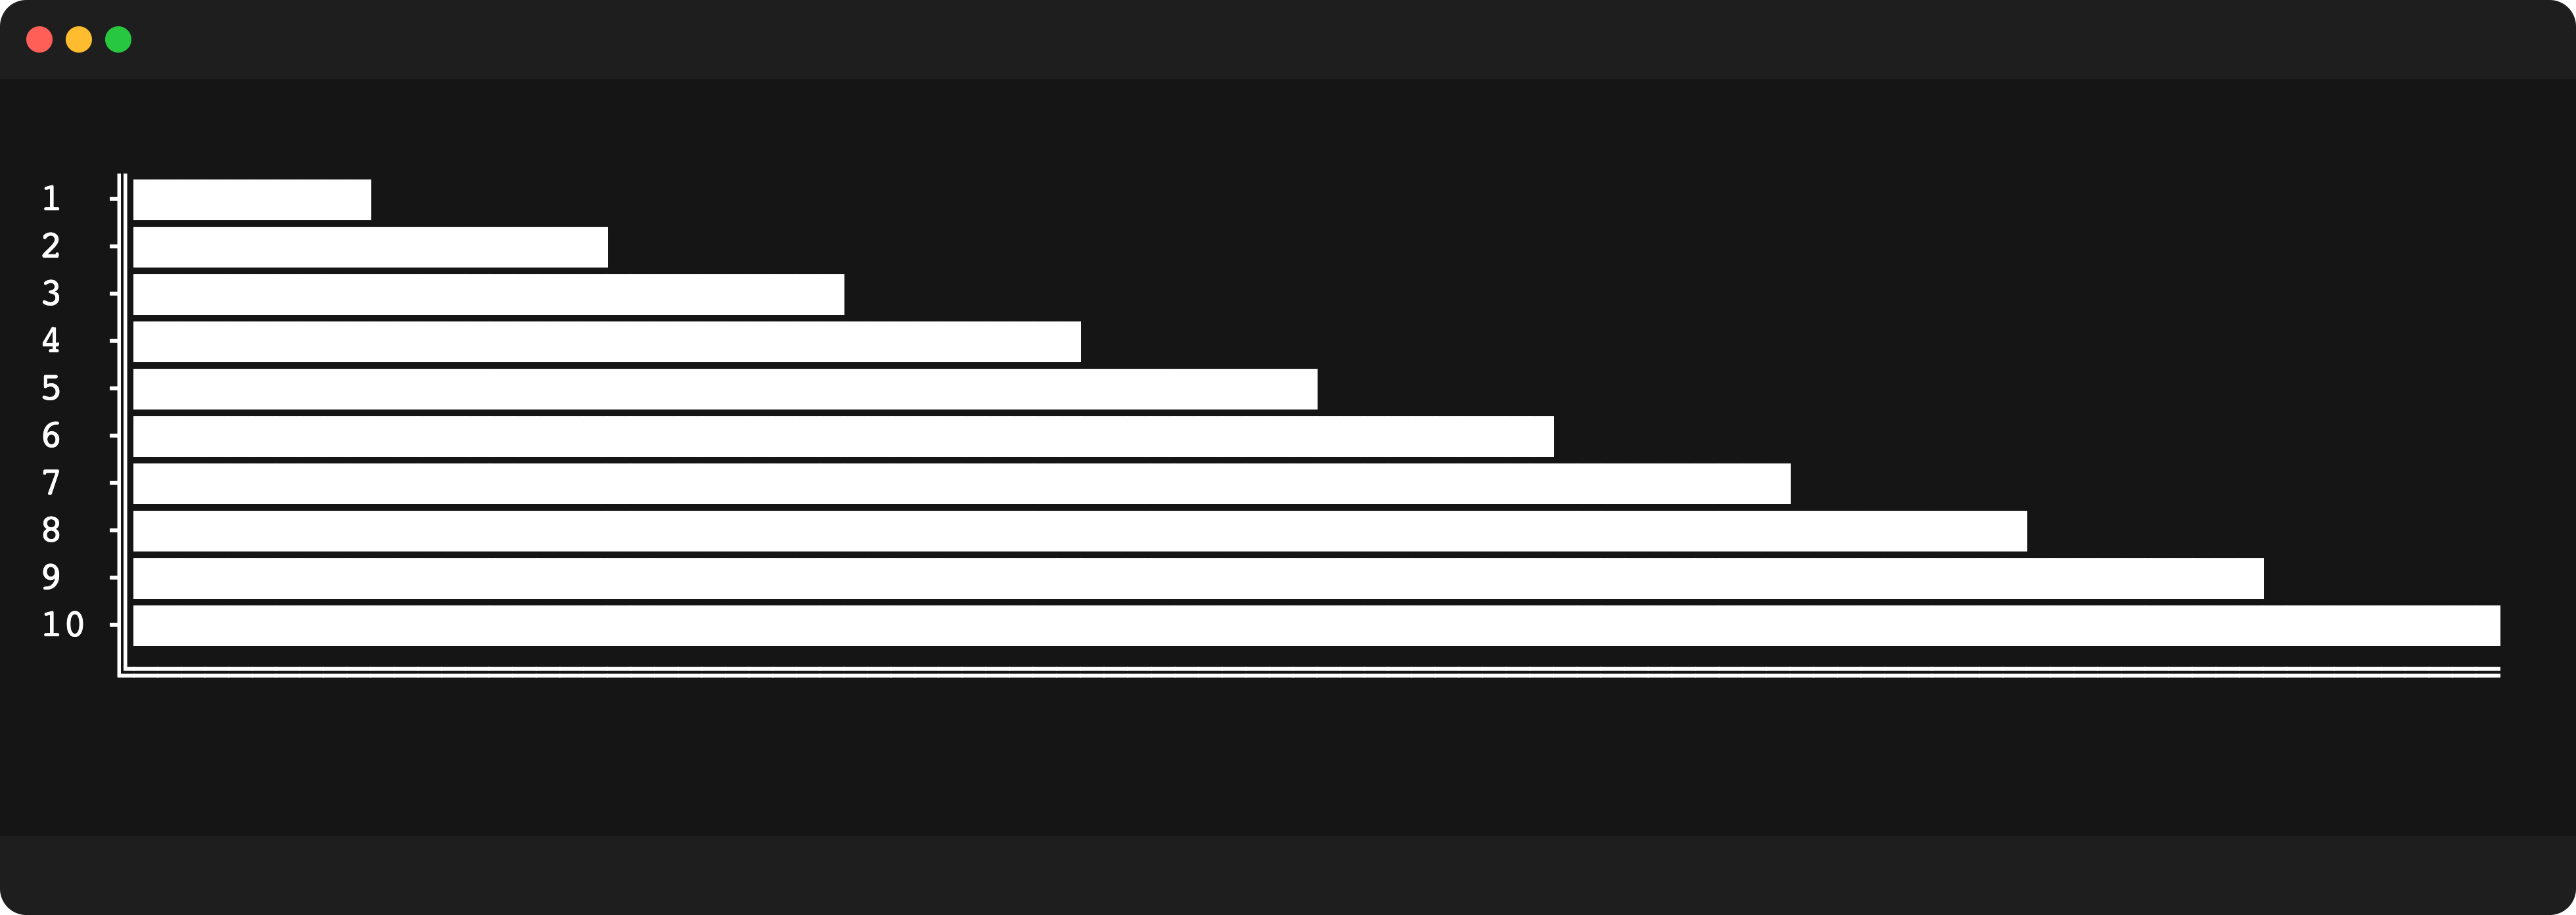
ChartPoint[]
For maximum flexibility, provide an array of chart points. This will allow you to customize the following properties:
| name | description | type | default |
|---|---|---|---|
| label | bar label | string | point.value |
| value | bar value | number | N/A |
| color | bar color | string | options.color |
example
import Chartscii from 'chartscii';

const data = [{ label: 'label', value: 2, color: 'pink' }, { label: 'label', value: 2, color: 'purple' }, { label: 'label', value: 2, color: 'marine' },];
const chart = new Chartscii(data, { colorLabels: true });
console.log(chart.create());
Options
You can customize the look and size of the chart, as well as rich formatting for labels provided by styl3.
default options
Chartscii accepts customization options as a second argument and will merge the provided options with the following one:
const options: ChartOptions = {
  percentage: false,
  colorLabels: false,
  sort: false,
  reverse: false,
  naked: false,
  labels: true,
  color: undefined,
  fill: undefined,
  width: 100,
  height: 10,
  padding: 0,
  barSize: 1,
  title: "",
  char: "█",
  orientation: "horizontal",
  theme: "",
  structure: {
    x: "═",
    y: "╢",
    axis: "║",
    topLeft: "╔",
    bottomLeft: "╚"
  }
};
customization options
| name | description | type | default |
|---|---|---|---|
| percentage | calculate and show percentage data | boolean | false |
| colorLabels | color labels with provided color per label, or color provided to option | boolean | false |
| sort | sort the input data | boolean | false |
| reverse | reverse the input data | boolean | false |
| naked | don’t print chart structure ascii characters | boolean | false |
| labels | show labels | boolean | true |
| color | fallback color or unified char bars color | string | undefined |
| fill | use this character to fill remaining chart bar space | string | undefined |
| maxValue | values are scaled proportionate to this value. otherwise the max will be calculated from the provided data. | number | undefined |
| width | width of chart | number | 100 |
| height | height of chart | number | 10 |
| padding | padding between bars | number | 0 |
| barSize | size of each bar | number | 1 |
| title | chart title | string | undefined |
| char | use this character to draw the chart bars | string | █ |
| orientation | horizontal or vertical | string | horizontal |
| theme | styl3's themes | string | undefined |
| structure | use these characters to draw the enclosing chart borders. | object | { x: '═', y: '╢', bottomLeft: '╚', axis: '║', topLeft: '╔' } |
chartscii + styl3 = ❤️
You can use styl3’s formatting for cool themes, built-in color names and rich label formatting.
You should check out styl3 for a full list of customization options.
example
const colors = [
  "red",
  "green",
  "yellow",
  "blue",
  "purple",
  "pink",
  "cyan",
  "orange"
];

const data = [];
for (let i = 0; i < colors.length; i++) {
  const color = colors[i];
  data.push({ value: i + 1, color, label: `@invert ${i}@`, theme: "pastel" });
}

const chart = new Chartscii(data, {
  fill: "░",
  colorLabels: true,
  orientation: "vertical"
});

console.log(chart.create());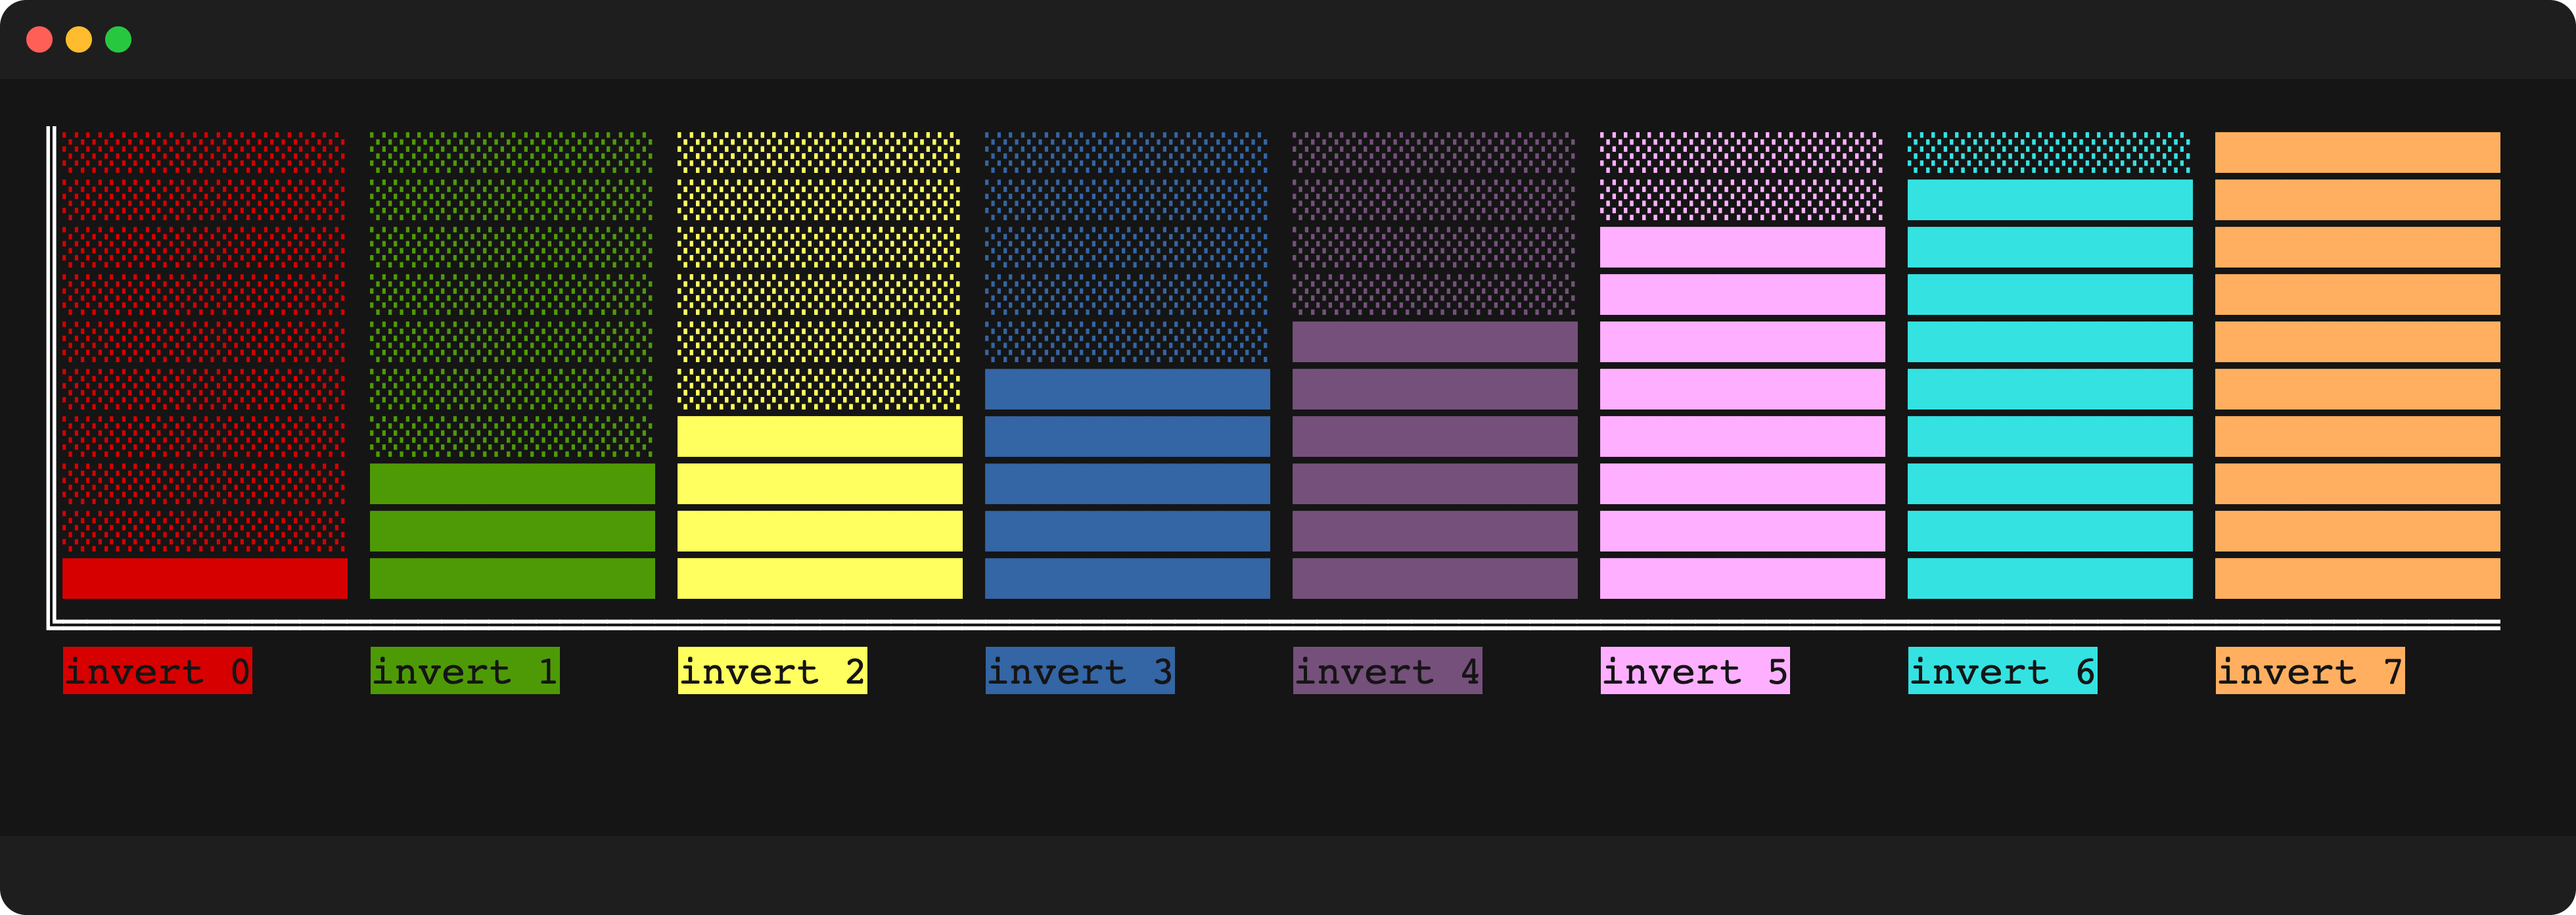
examples
here are some examples of charts using styl3's formatting on the chart labels.
!TIP
you can run more examples from the./examples/directory of this repository usingts-node.
for examplenpx ts-node examples/loaders.ts
vertical
| options | chart |
|---|---|
| beach theme with italic and bold labels with a bar size of 2 | 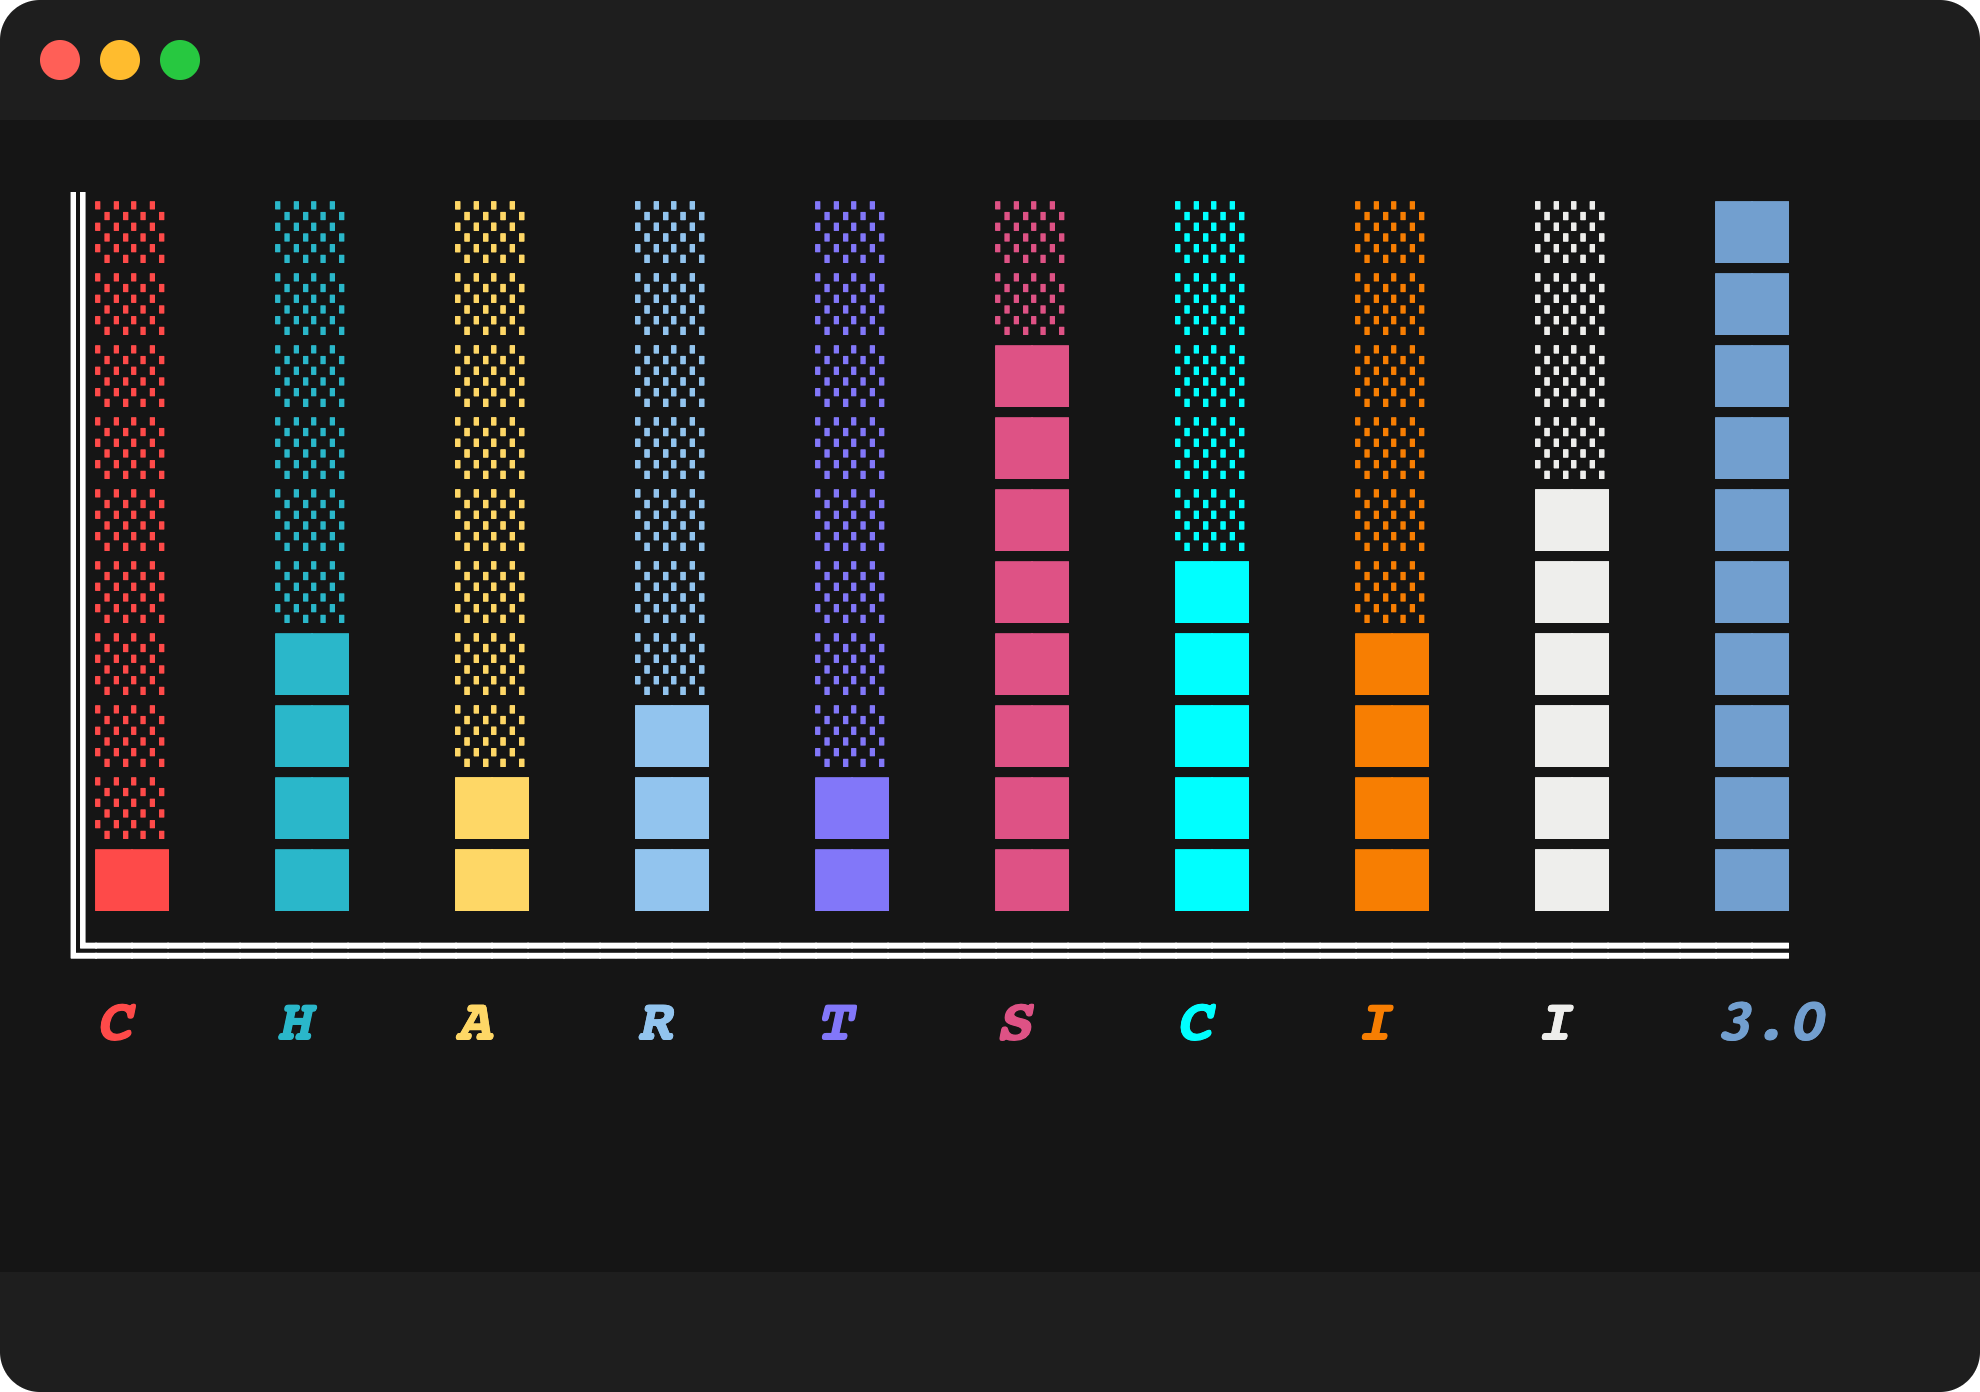 |
| pastel theme with bold and underlined labels with padding of 2 | 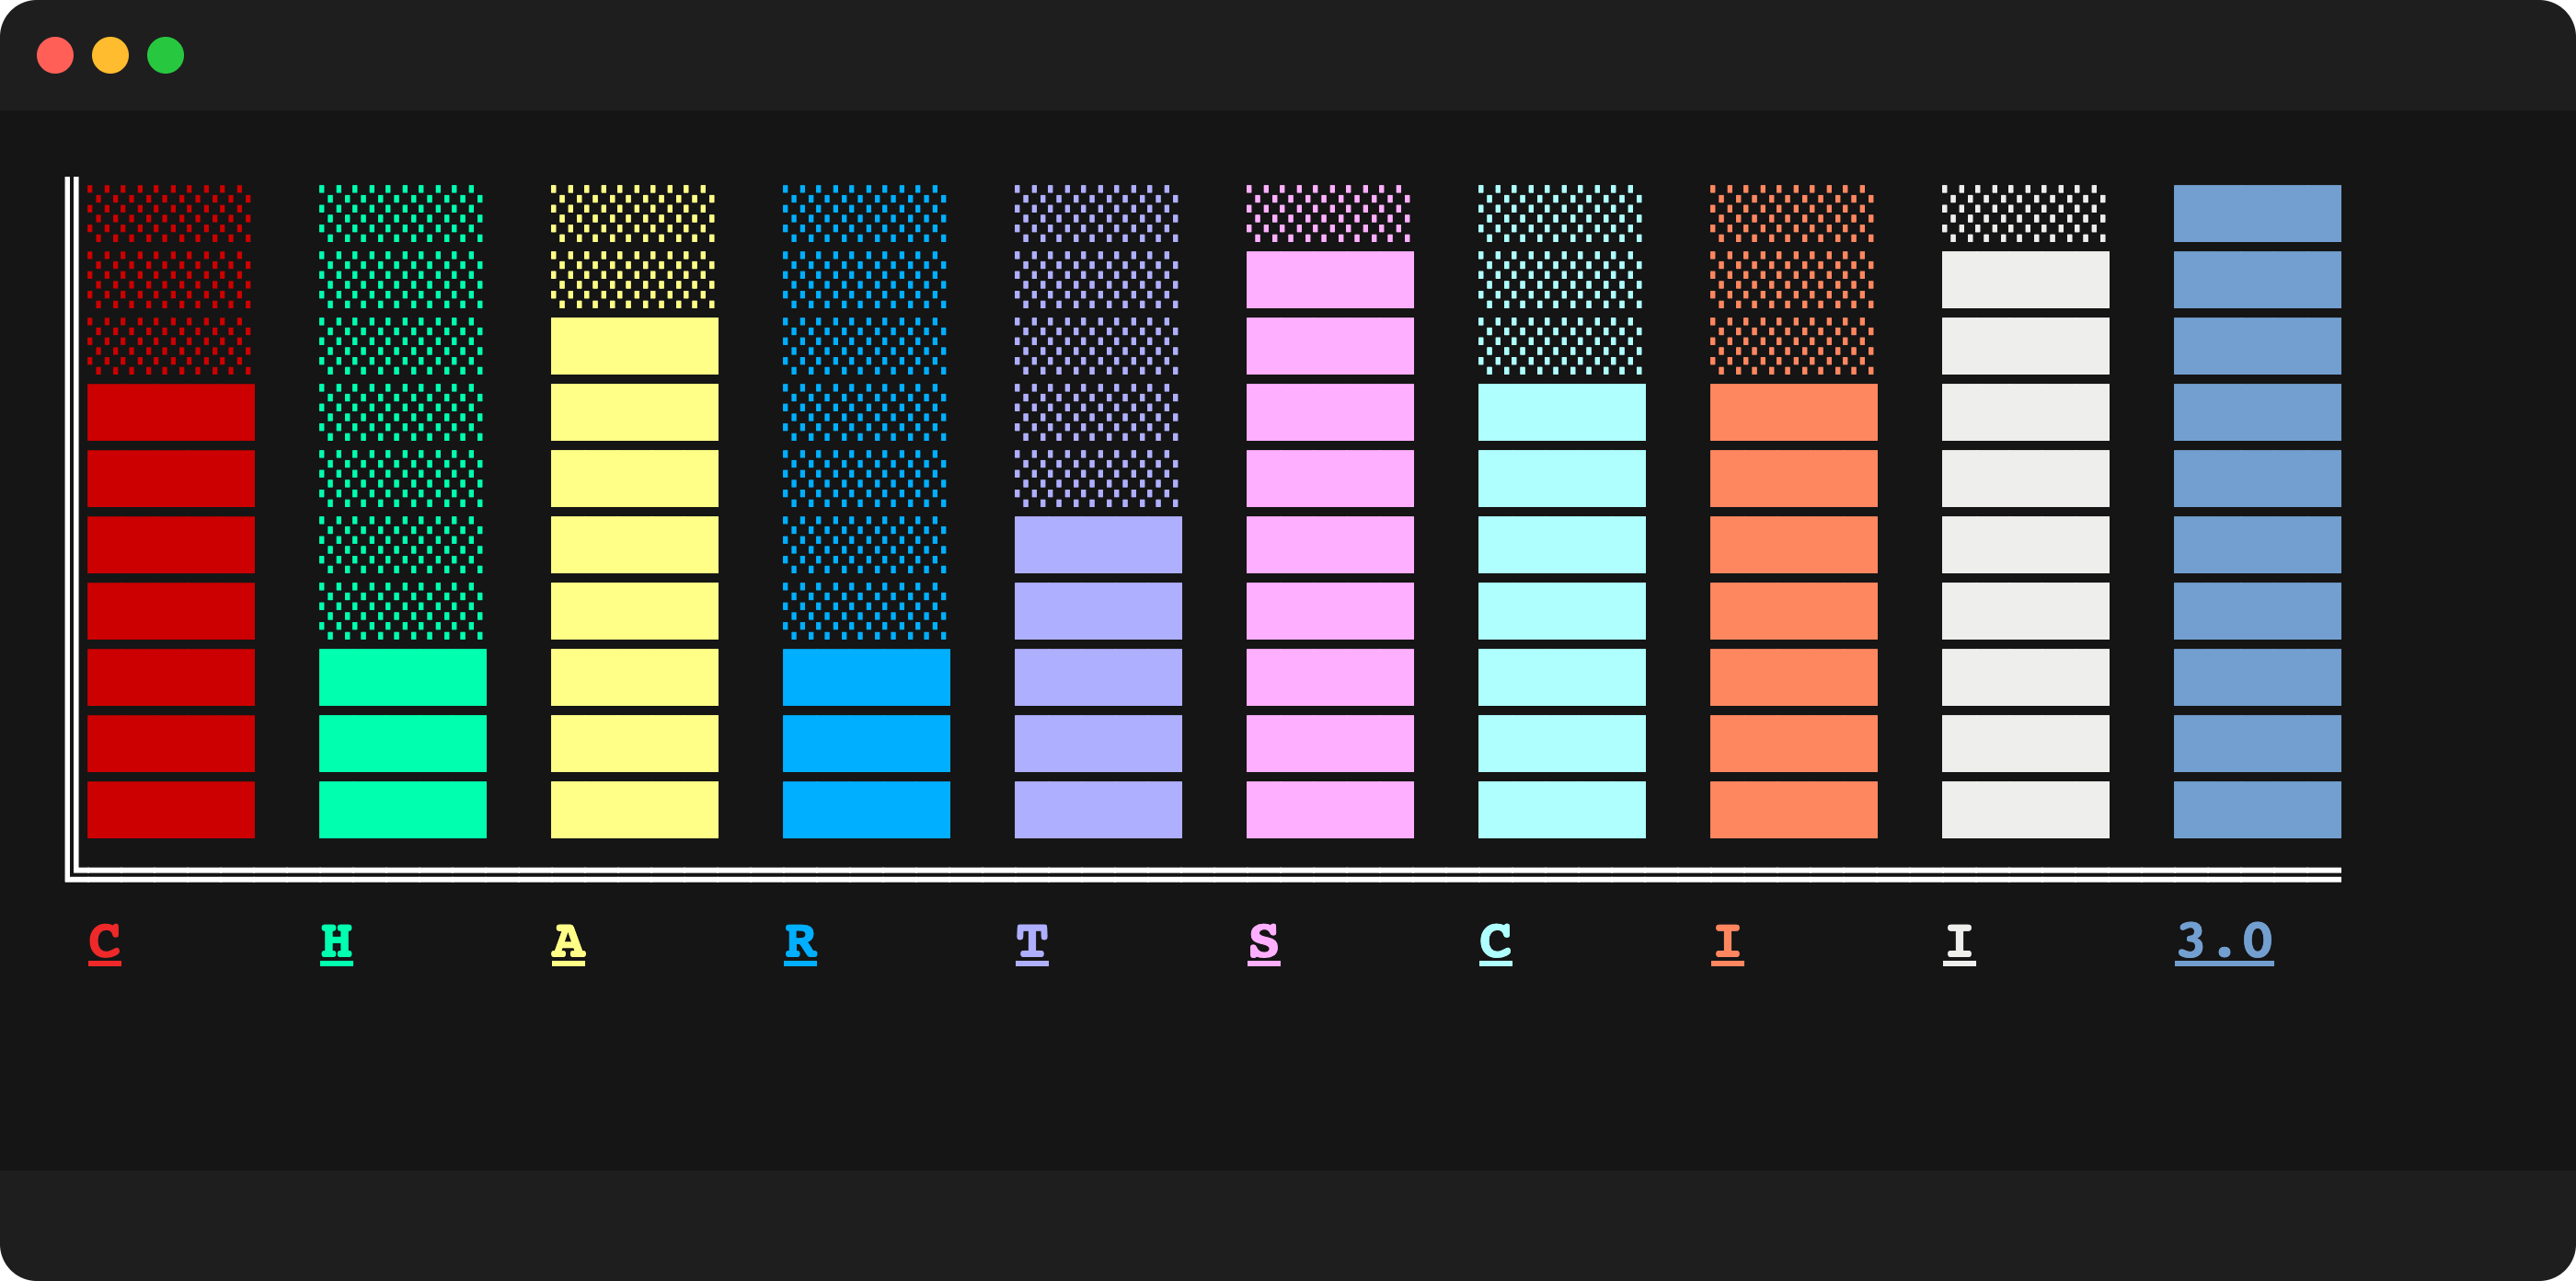 |
| lush theme with strikedout labels no padding and emoji | 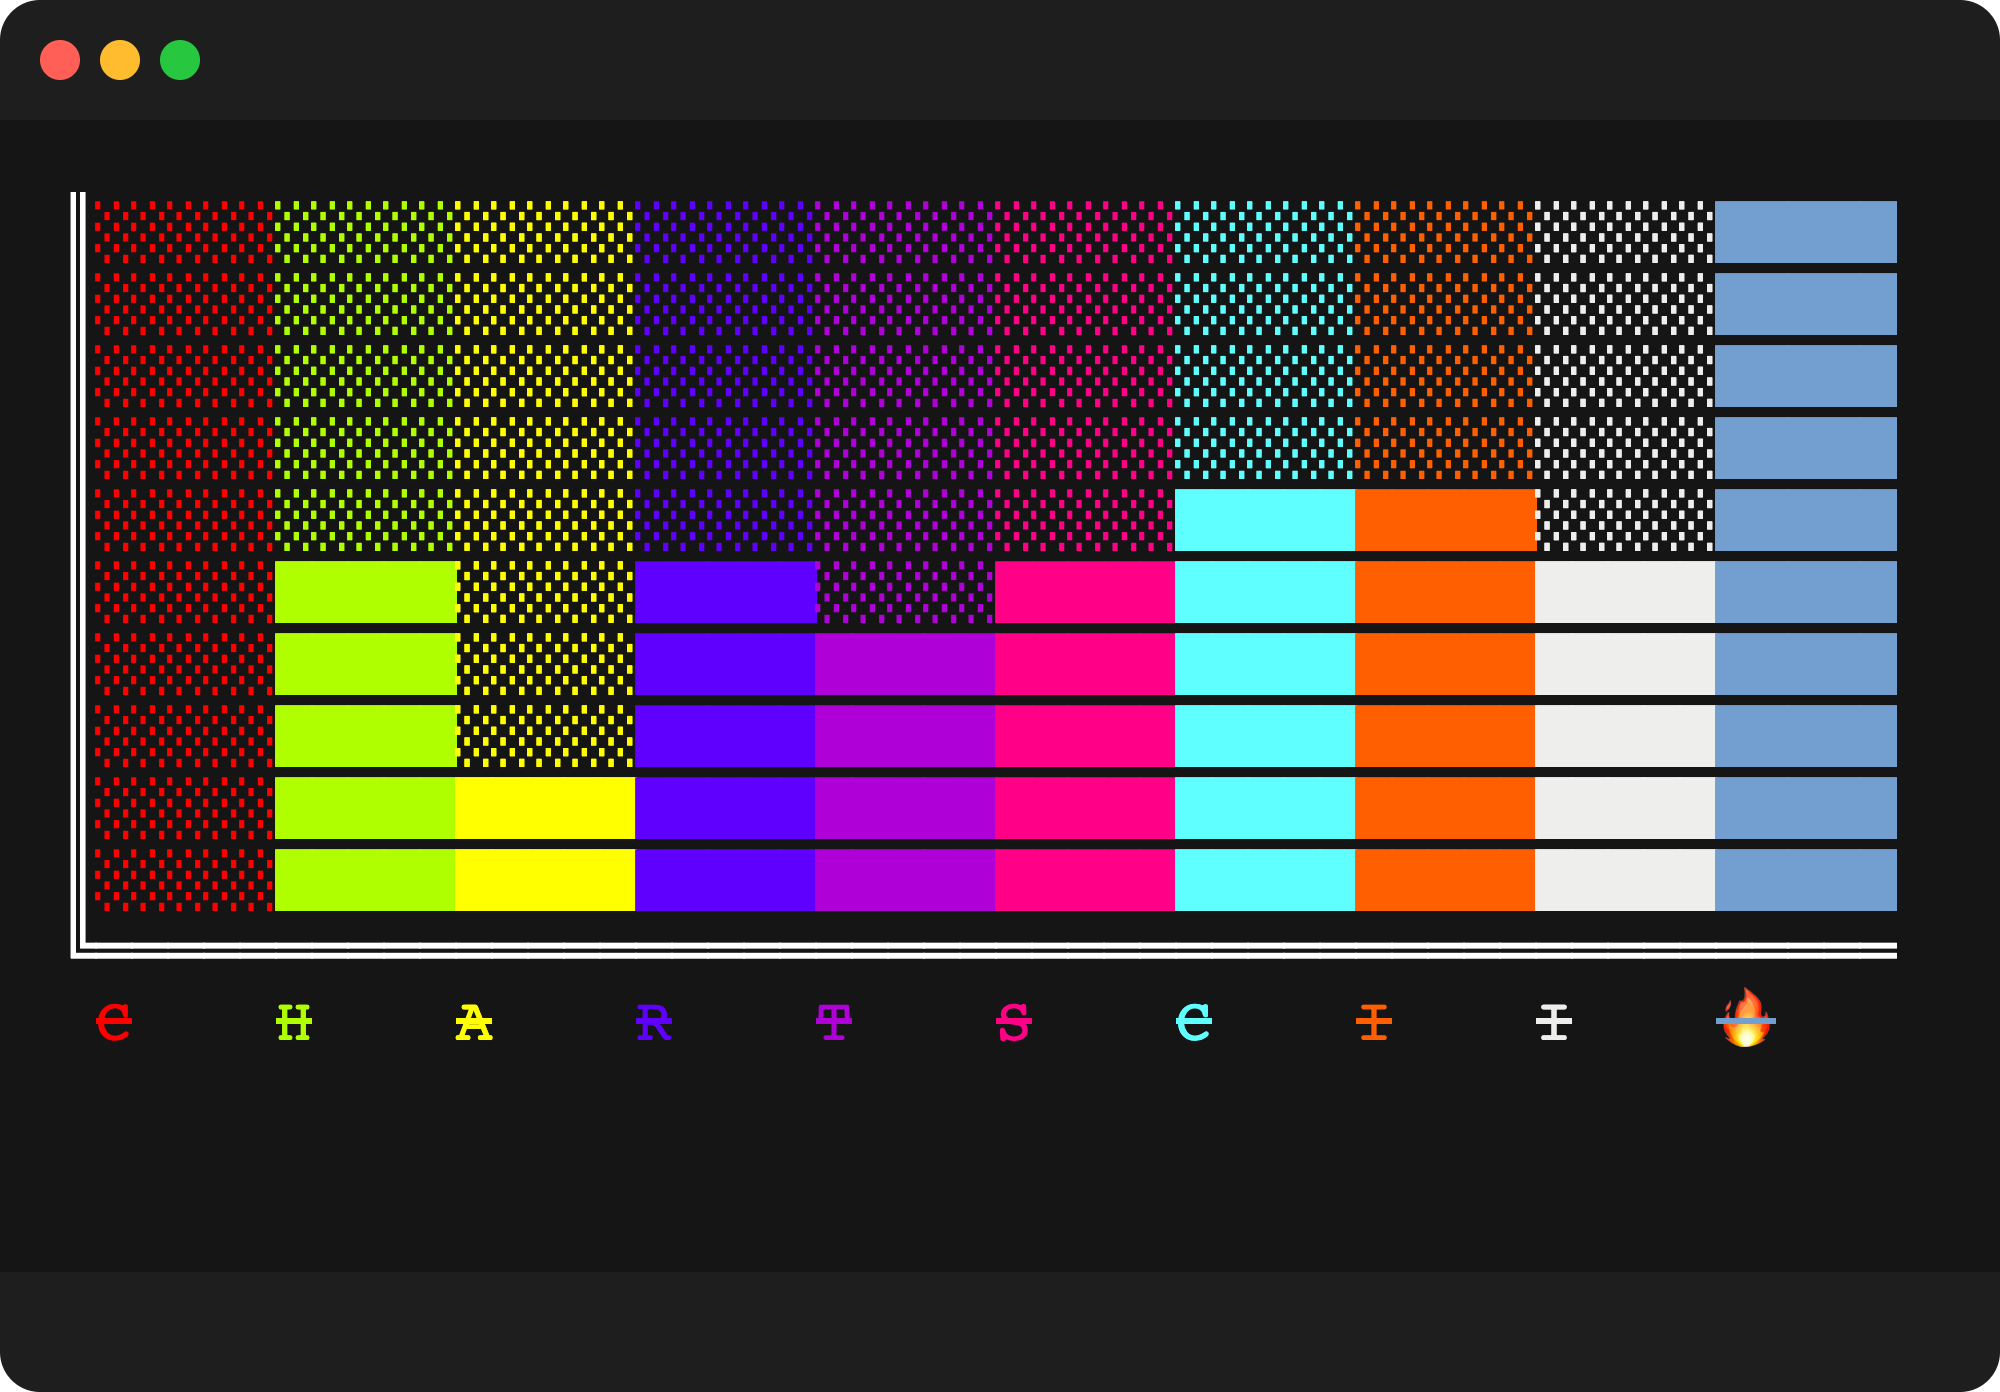 |
| lush theme with underlined labels no padding and no axis structure char | 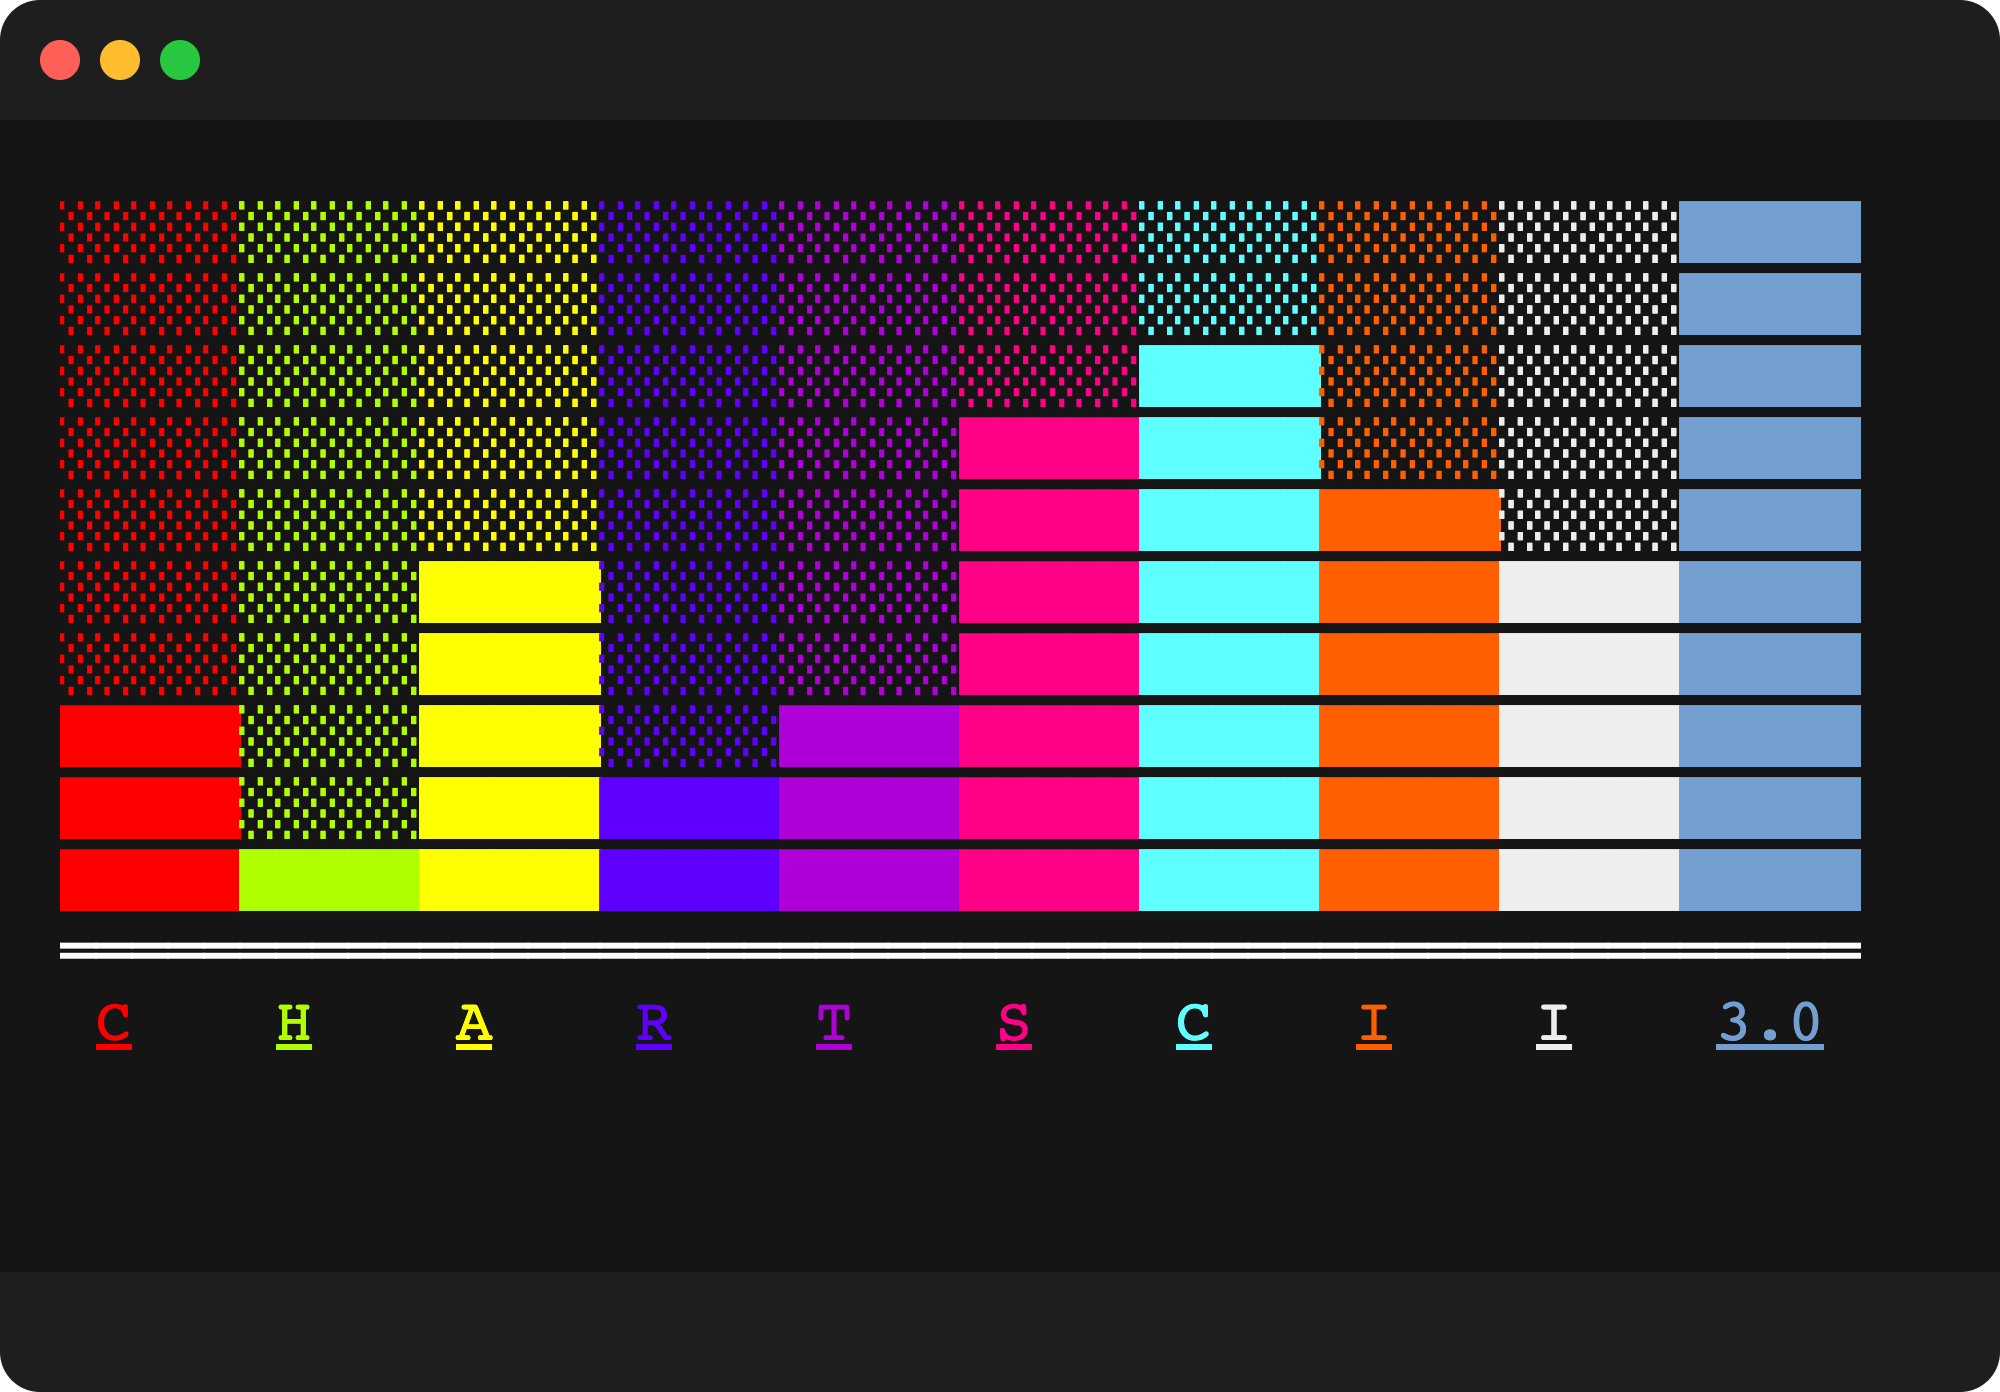 |
| standard theme with dimmed and italic labels and padding 1 | 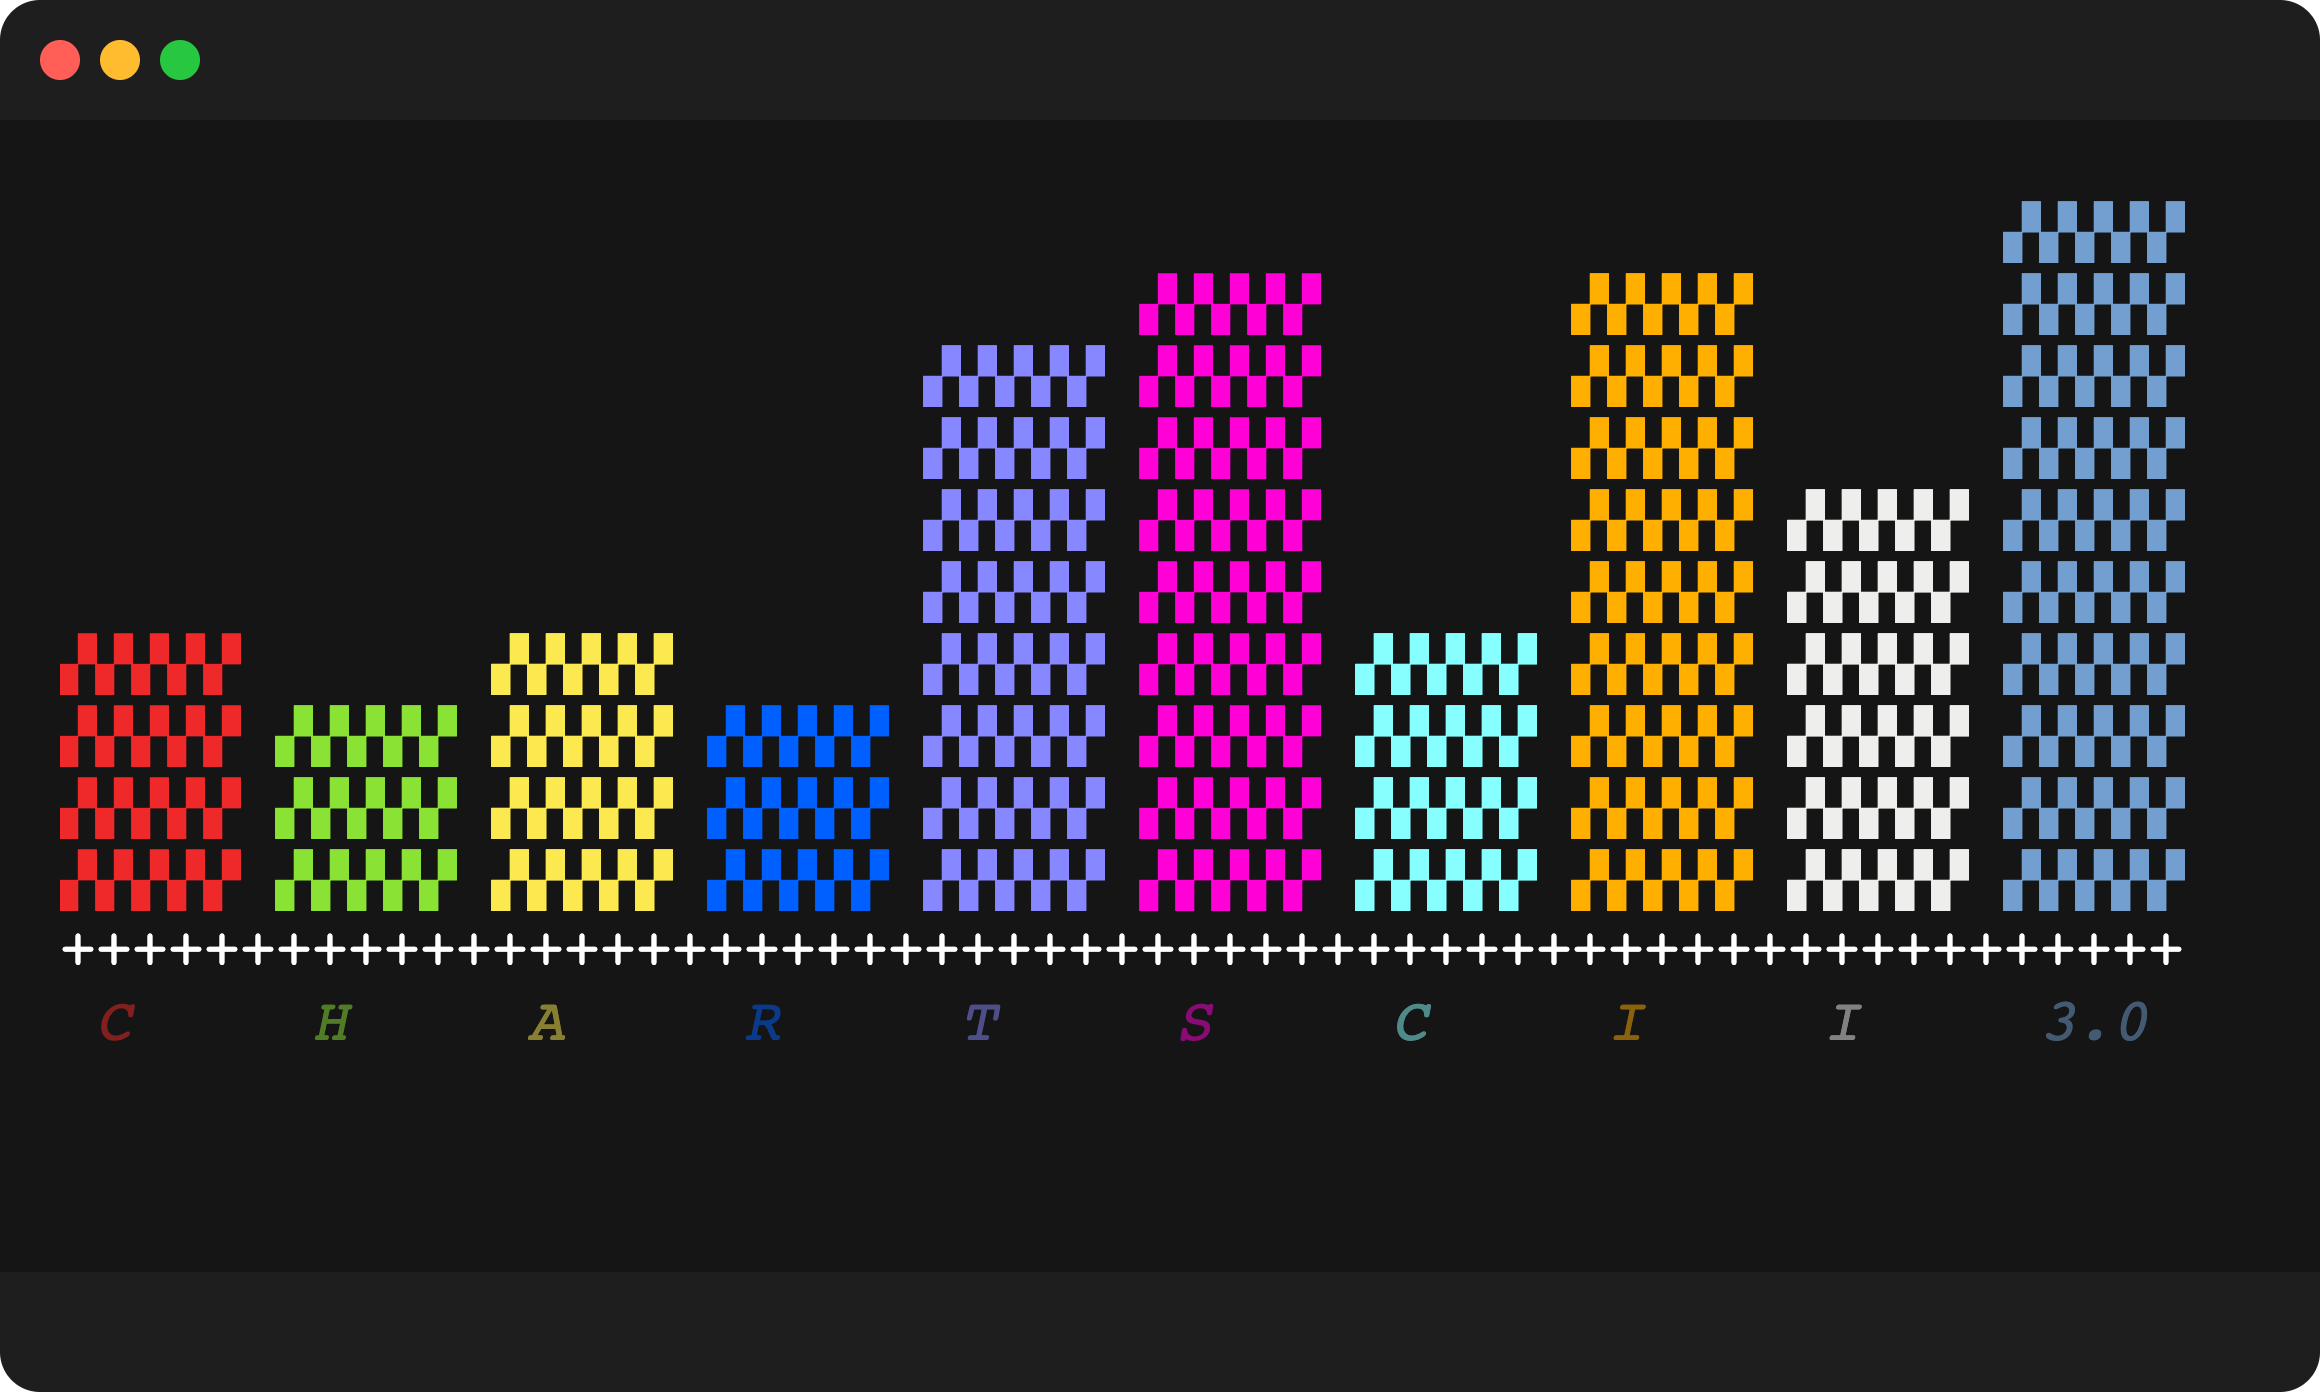 |
| pastel theme with inverted and underlined labels with a dark fill character | 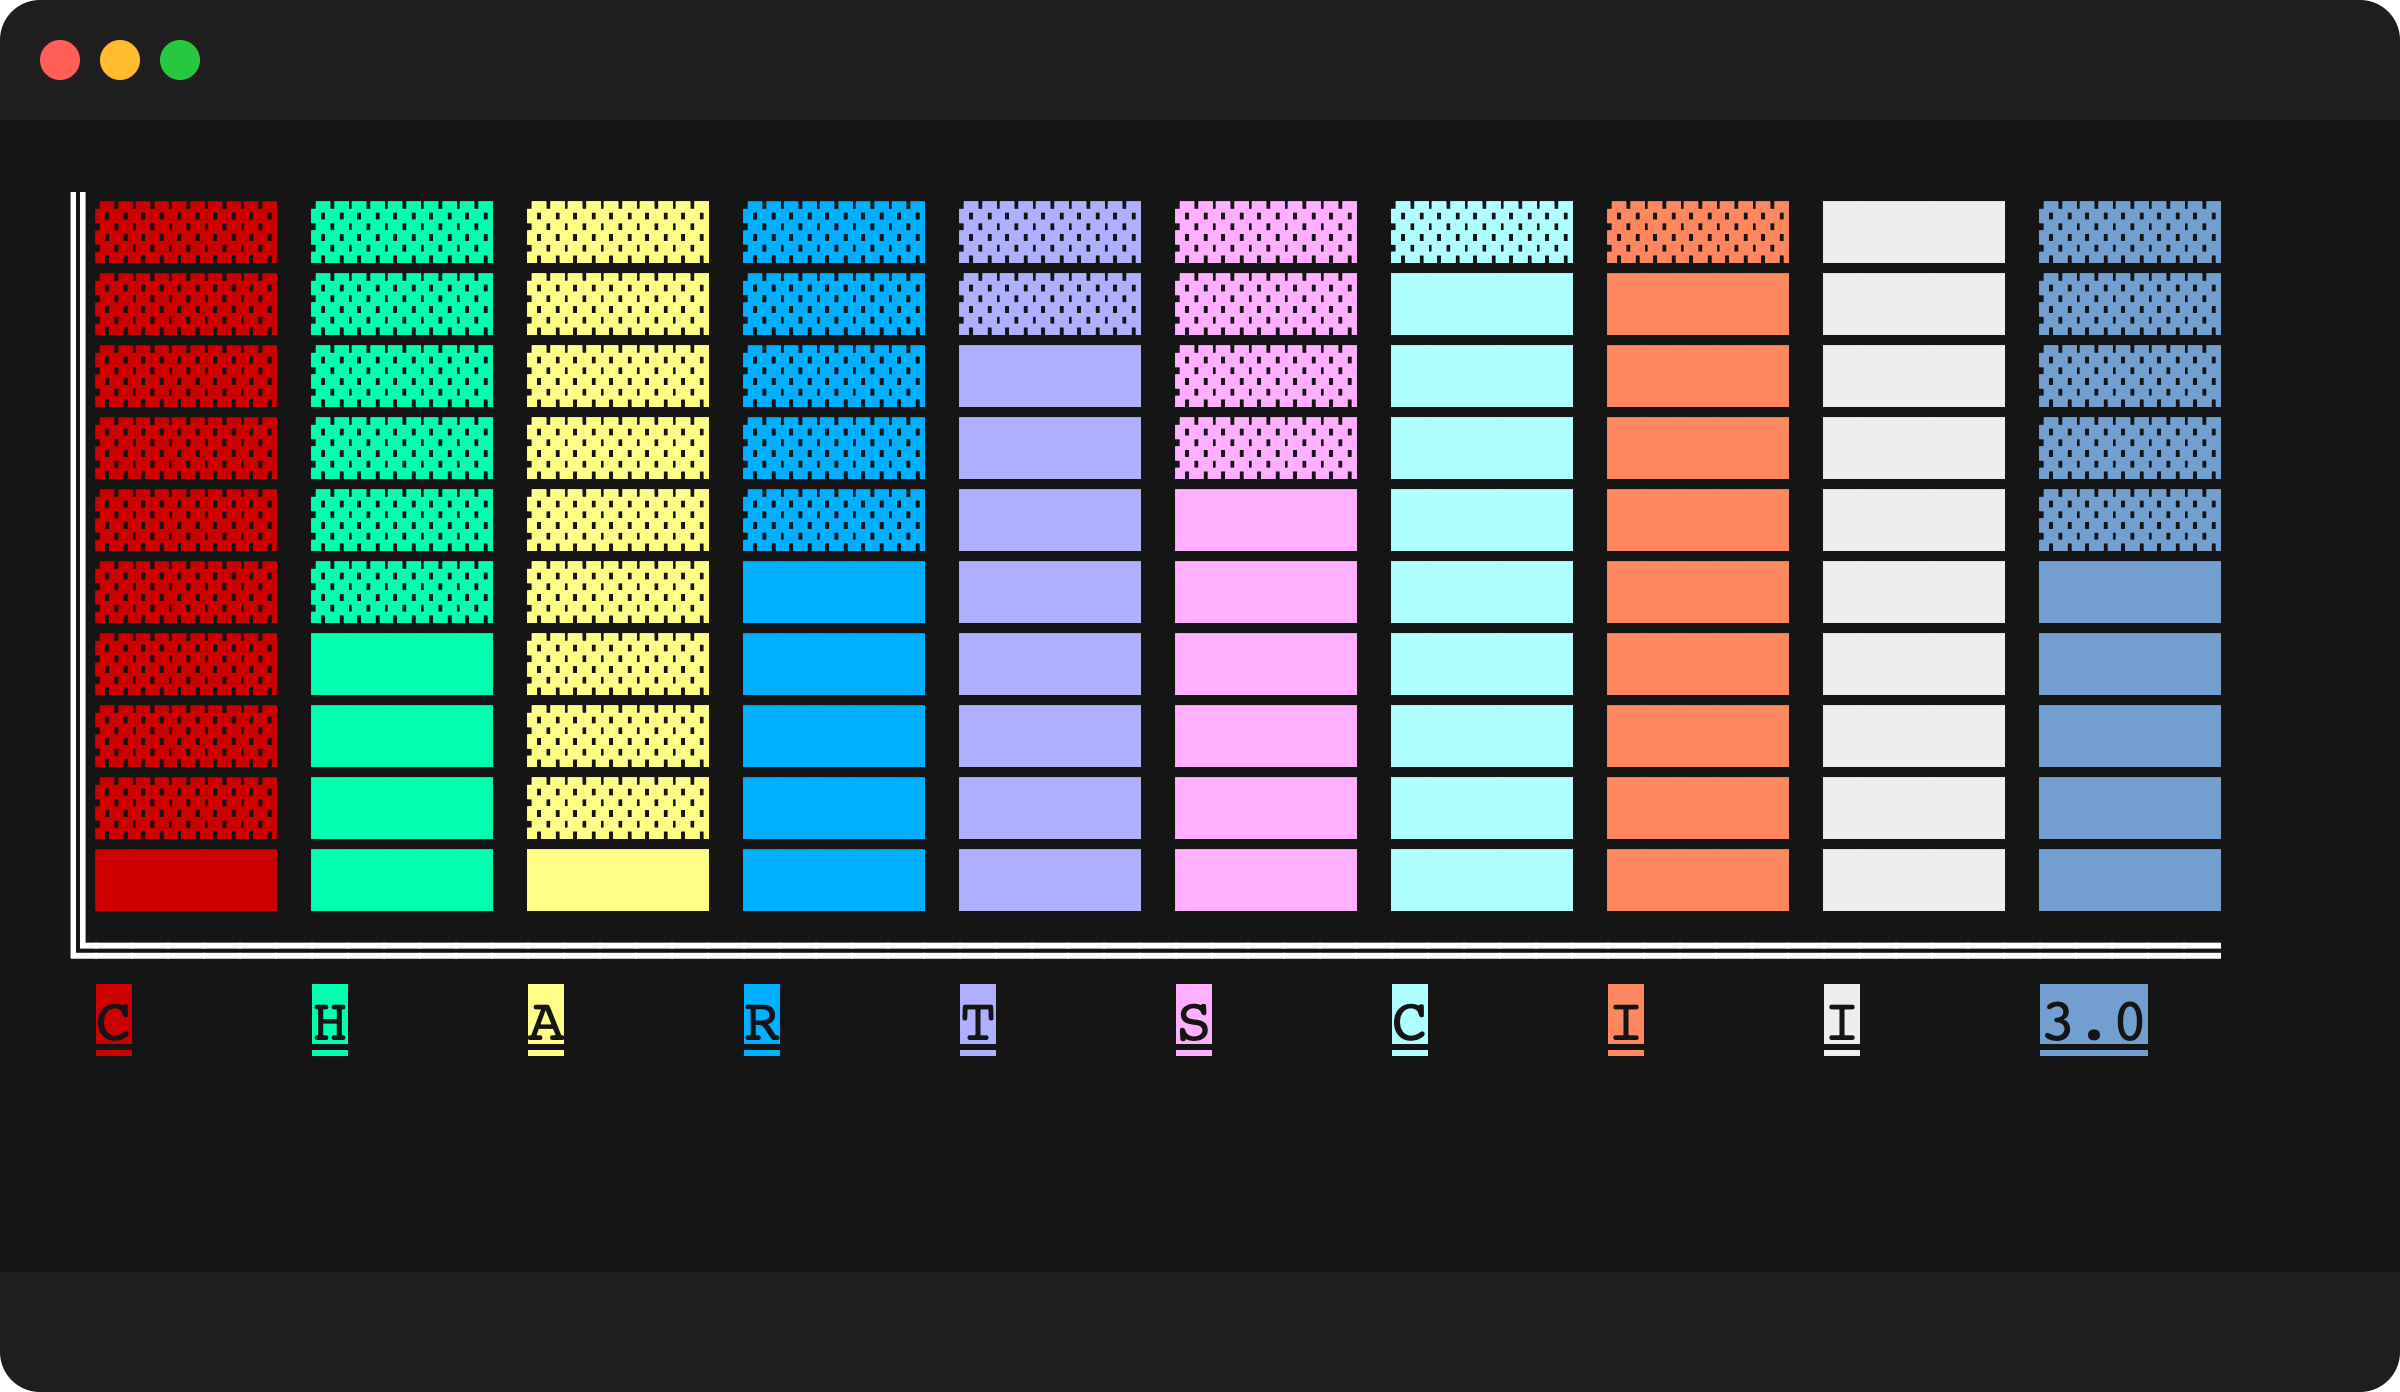 |
horizontal
| options | chart |
|---|---|
| pastel theme with bold labels and percentage |  |
| lush theme with inverted labels and naked chart |  |
| beach theme with underlined labels and different structure characters | 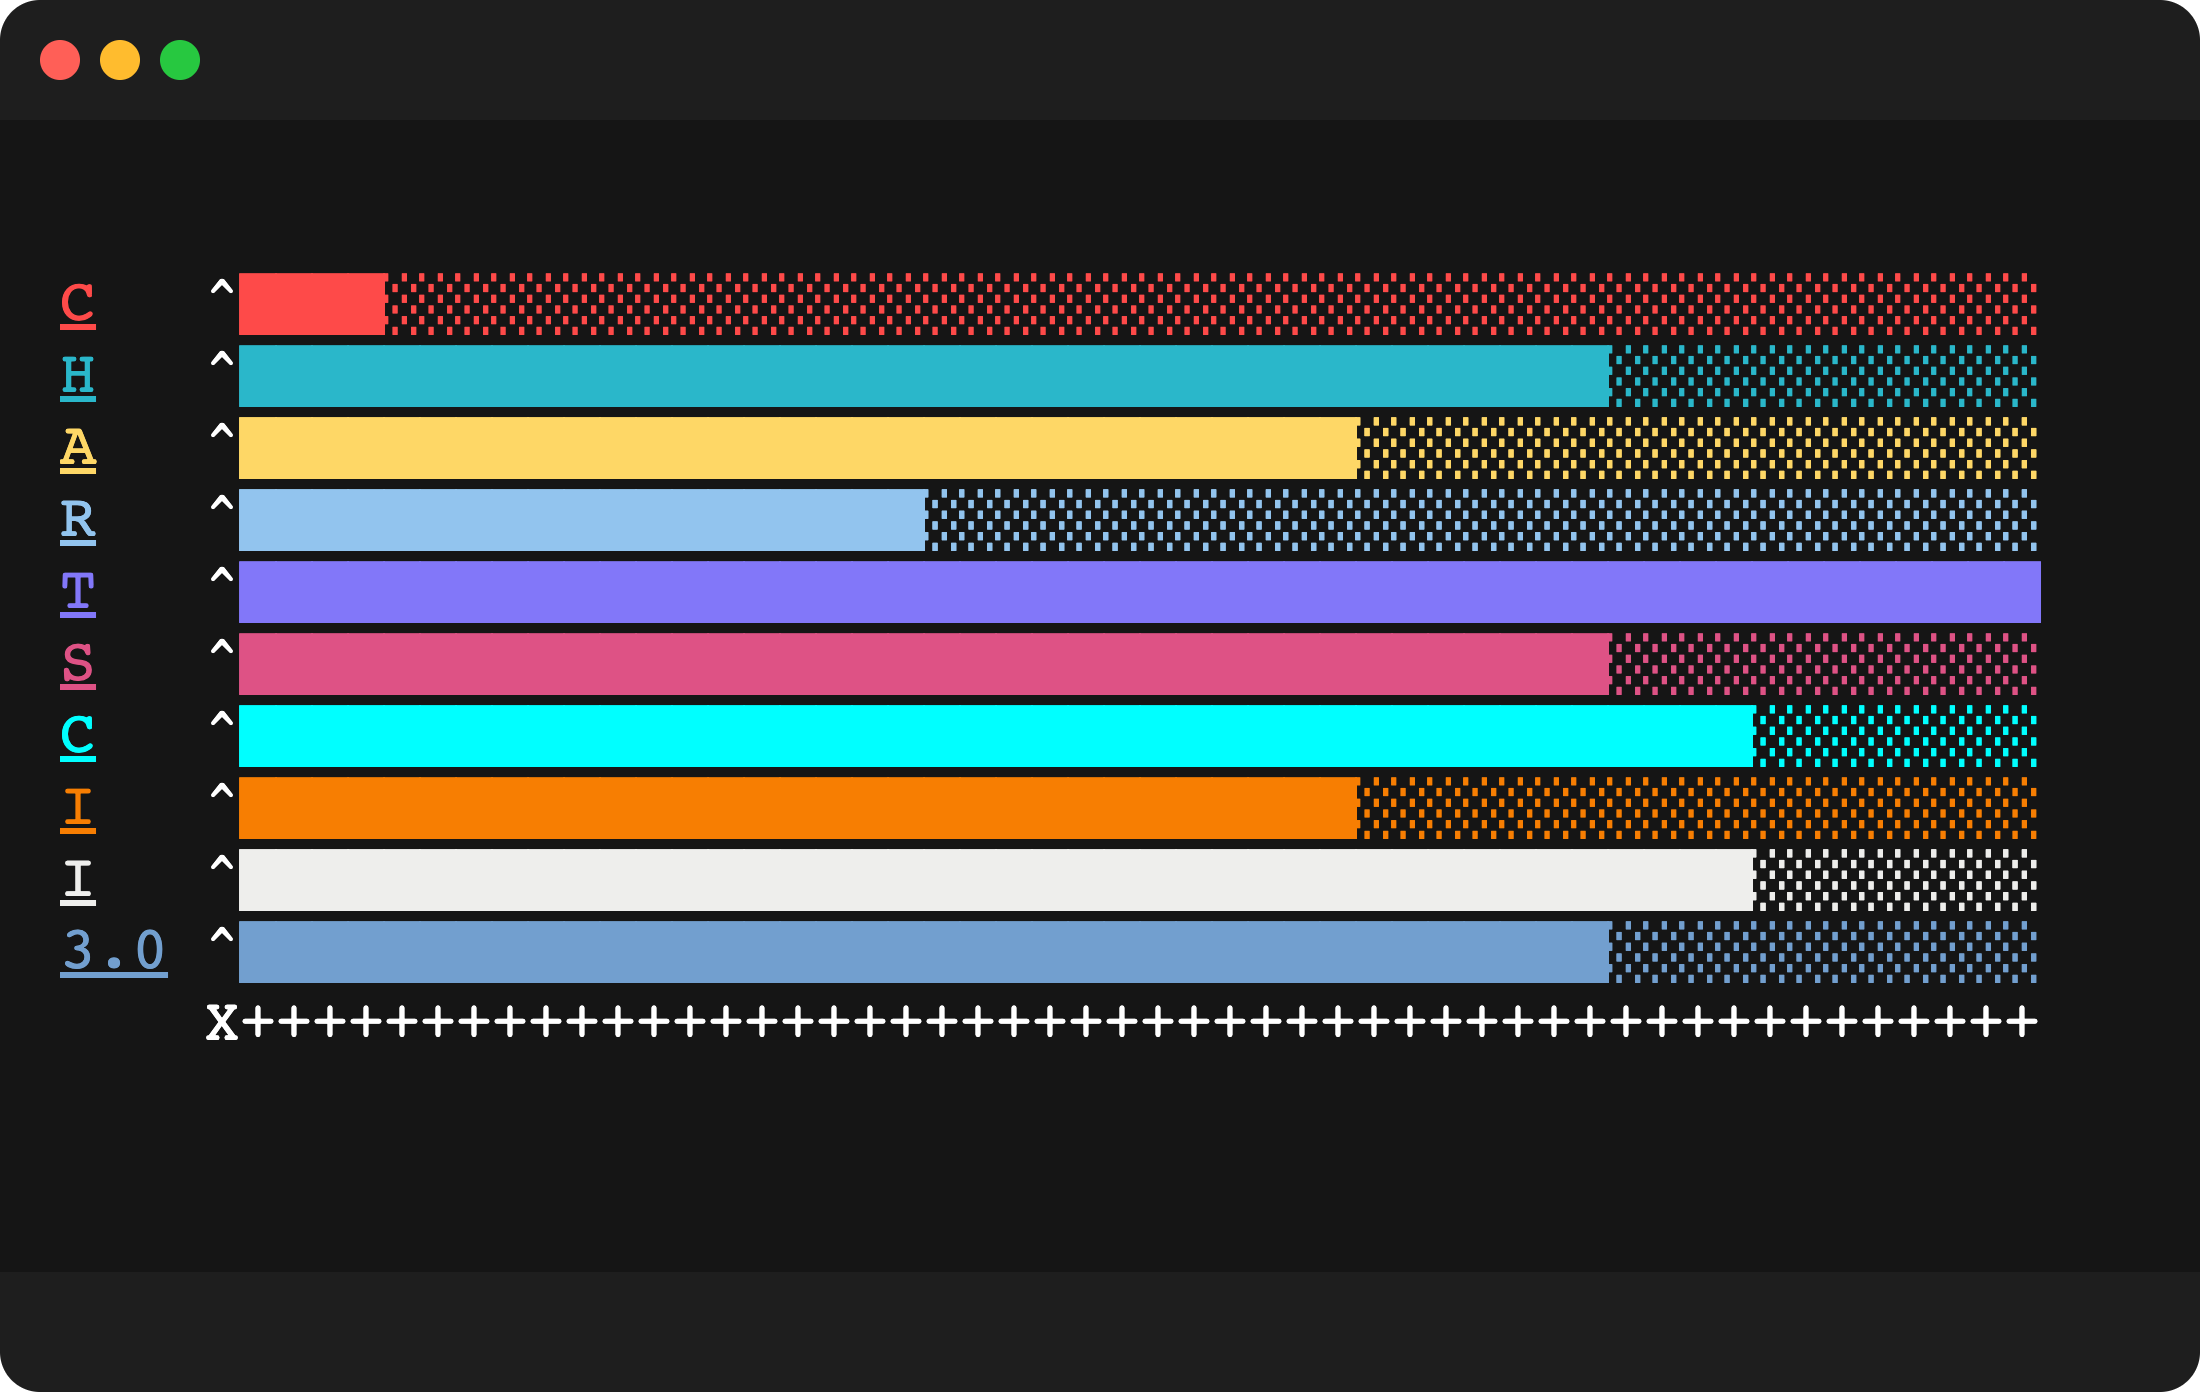 |
| pastel theme with padding of 1 and custom char | 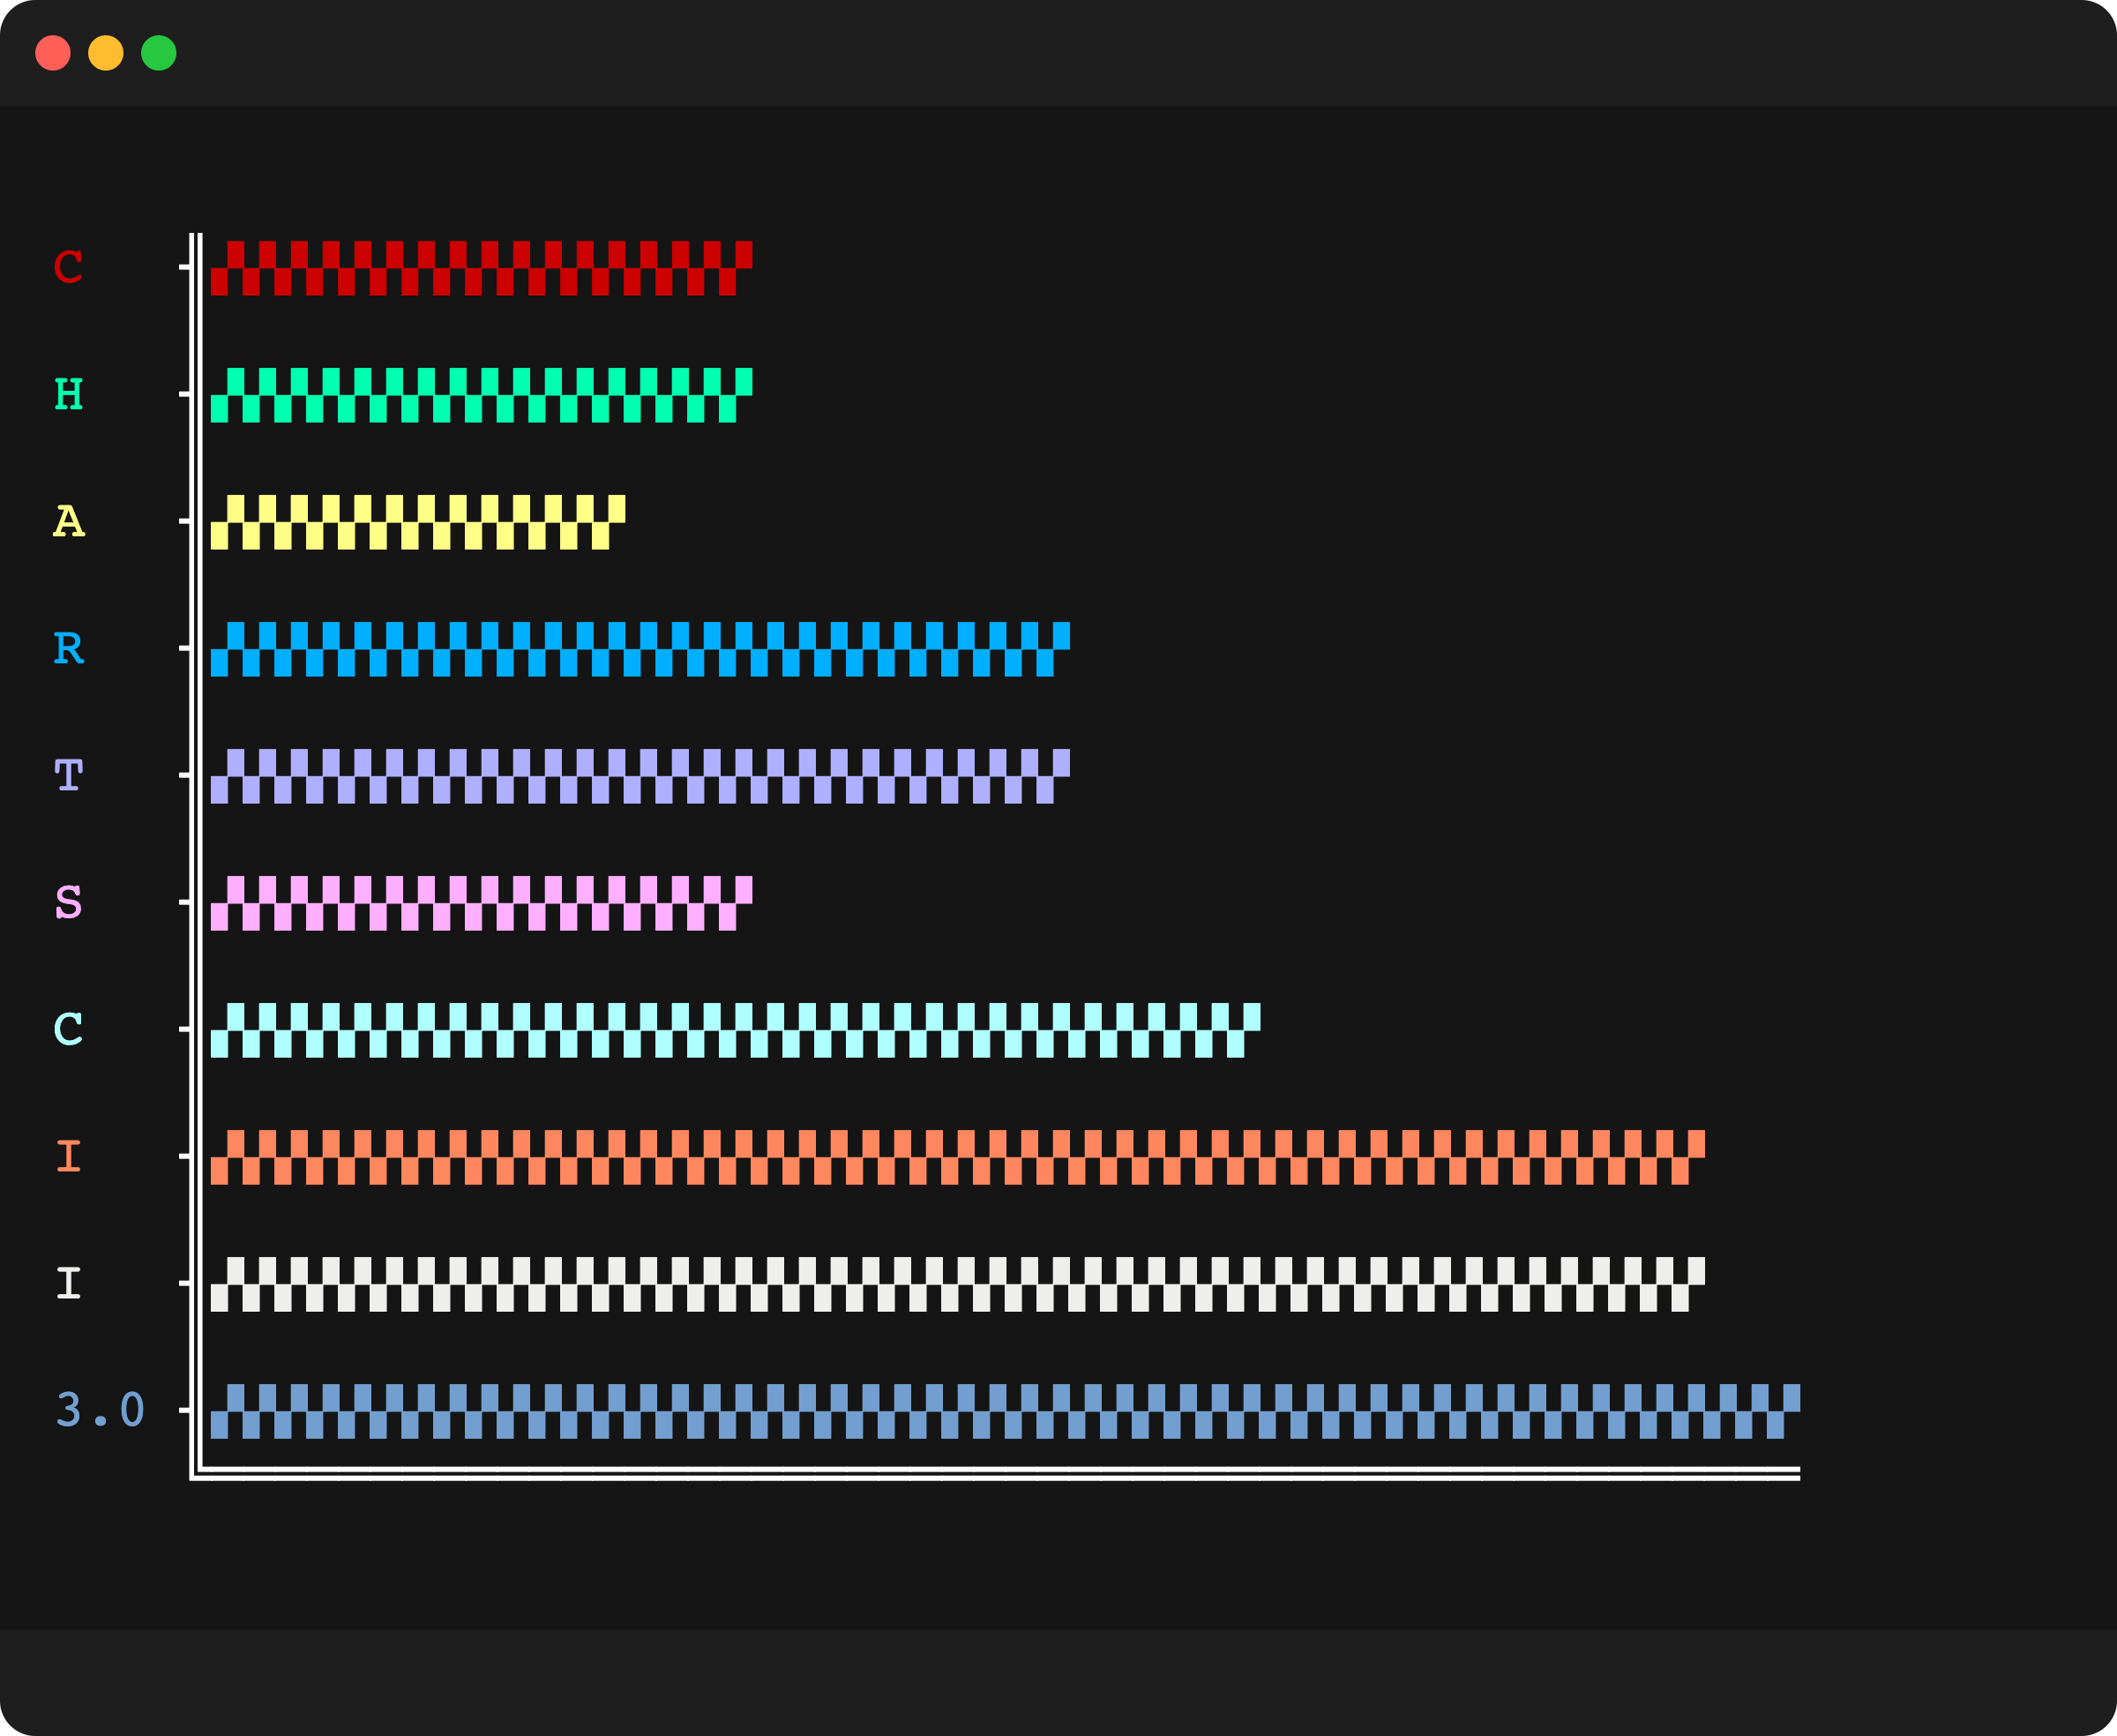 |
| pastel theme with naked chart - can be used to create loaders | 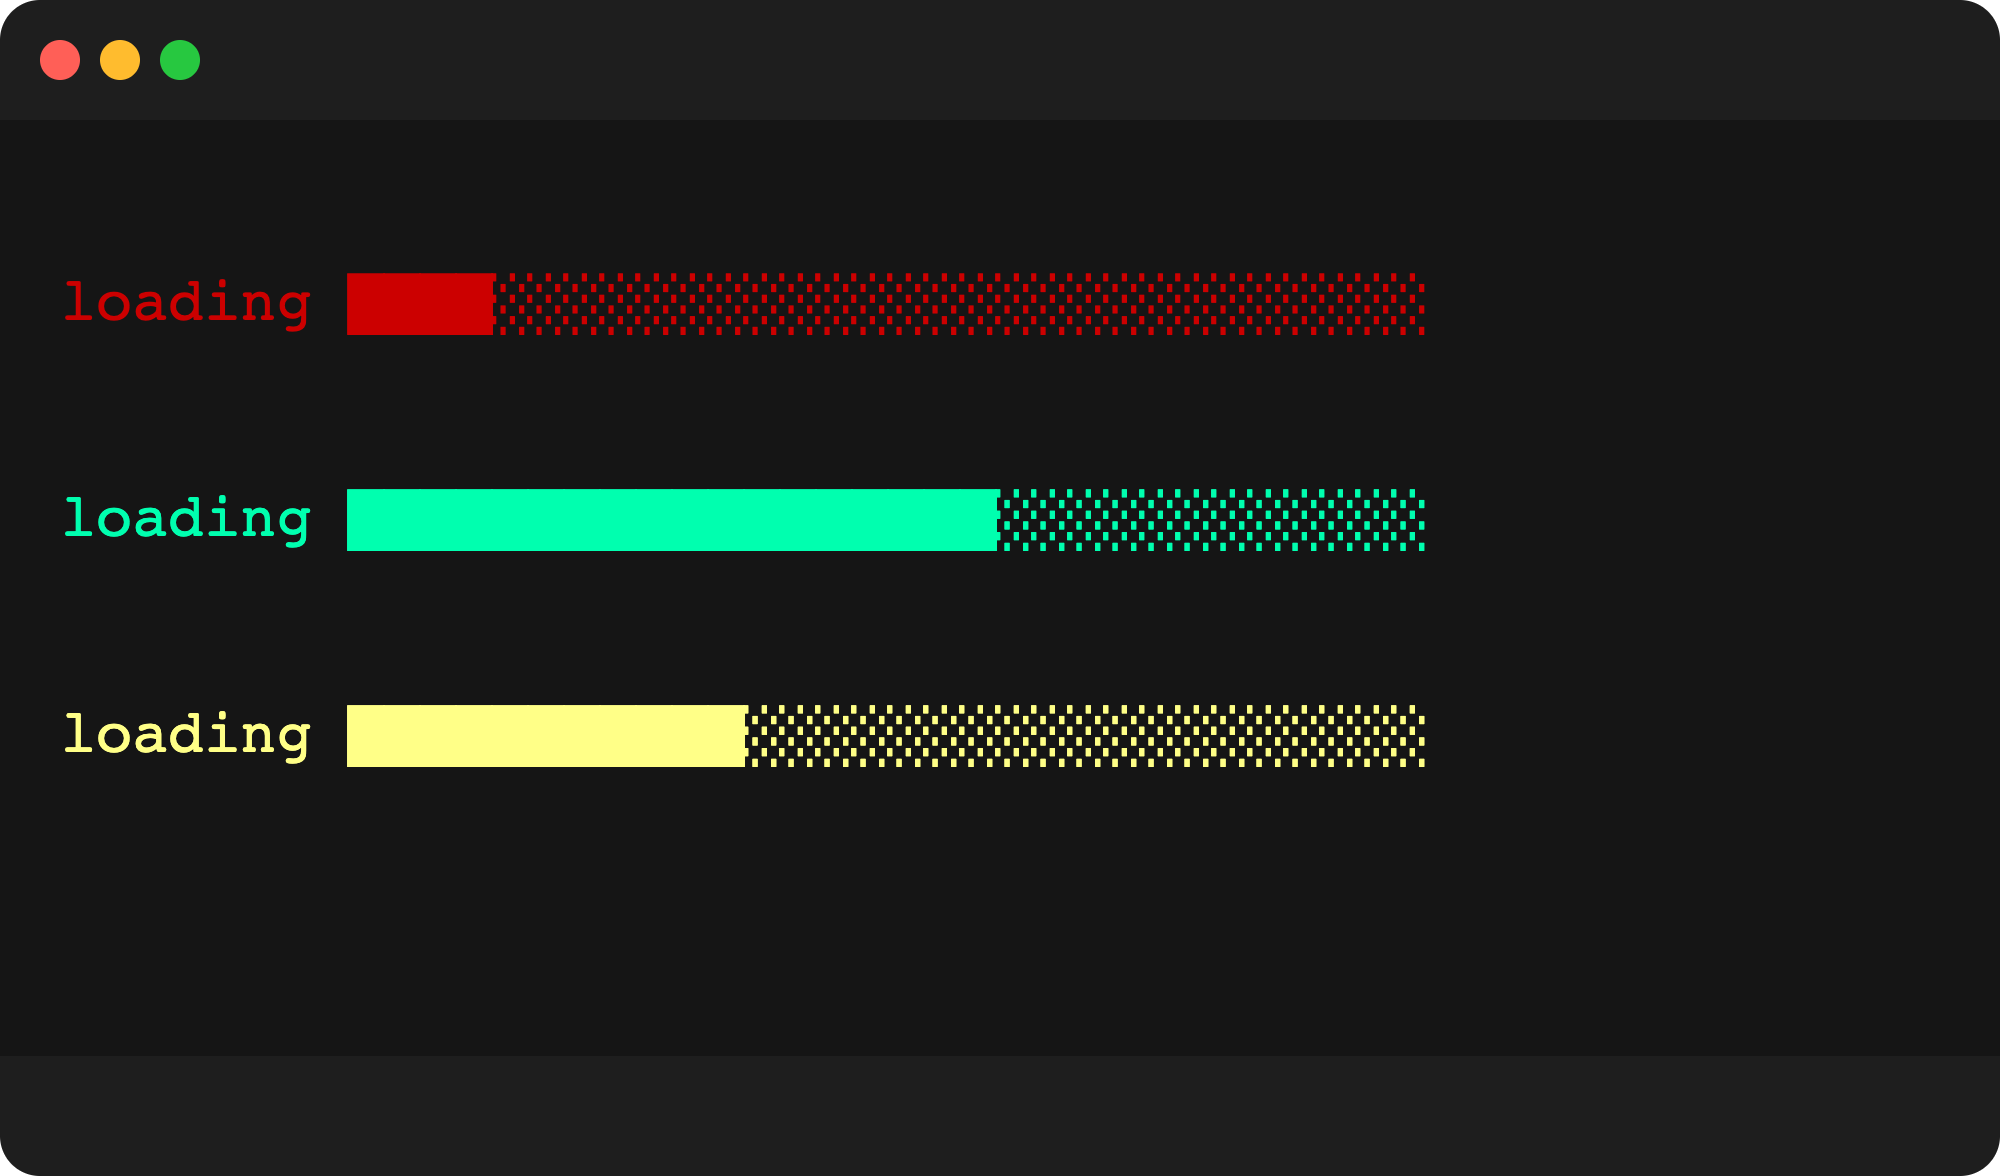 |
Unicode issues
Unfortunately, there are some known issues with specific unicode characters width.
This means that some emoji/unicode characters renders as 2 characters wide (or more) instead of 1, which is not a problem in itself.
The problem is that Javscript determines this length as 1, which creates an issue with label alignment, or drawing the chart bars correctly.
!WARNING
If you have issues with label alignment, or the chart bars aren't spaced correctly - you are probably using an emoji/unicode character which produce the wrong width in javascript.
If you encounter this issue unfortunately the current solution is to simply use a different emoji.
(For example: 🔥 works well while ✅ will result in a misaligned chart).
PRs for this problem are more than welcome.
2 years ago
2 years ago
2 years ago
2 years ago
2 years ago
2 years ago
4 years ago
4 years ago
4 years ago
4 years ago
4 years ago
5 years ago
5 years ago
5 years ago
5 years ago
5 years ago
5 years ago
5 years ago
6 years ago
6 years ago
6 years ago
6 years ago
6 years ago
6 years ago
6 years ago
6 years ago
6 years ago
6 years ago
6 years ago
6 years ago
6 years ago
6 years ago
6 years ago
6 years ago
6 years ago
6 years ago
6 years ago
6 years ago
6 years ago
6 years ago
6 years ago
6 years ago
