dash_tvlwc v0.1.2
Source Code | Documentation | Live Demo
Dash Tradingview Lightweight Charts Components is a Dash component library. This component wraps TradingView's Lightweight Charts, the popular financial charting library written in Javascript, and extends it for use in Python Dash webapp.
Releases
| Date | Tag |
|---|---|
| 23 Feb 2023 | v0.1.1 |
Installation
This package is available in PyPI:
pip install dash_tvlwcDemo
Interactive demo
An interactive demo hosted and available here. The source code of this live demo can be found at ./demo/app.py.
The demo hosting on pythonanywhere somehow suffers from very slow callbacks. Fixing this soon.
Chart and series style options
- 1-to-1 chart and series option capability as in original lightweight chart
- See
./example/options.py
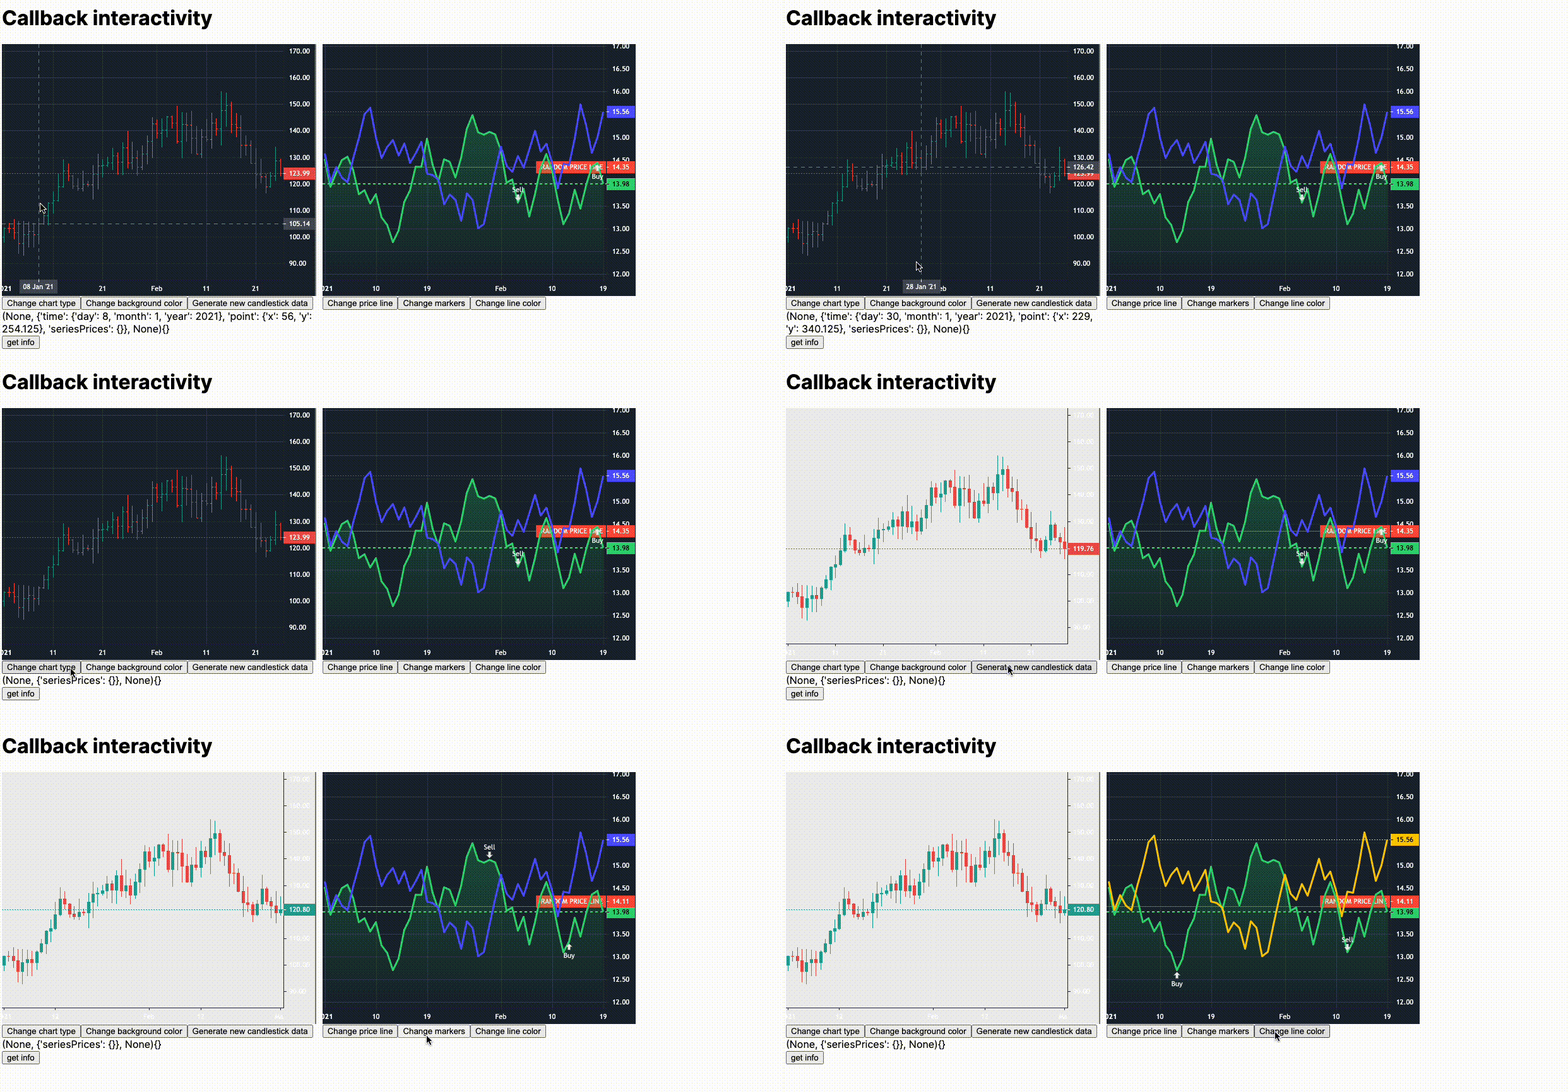
Interactivity with Dash callbacks
- Modify data or styles on any triggers
- See
./example/interactivity.py
Minimal example
The source code of this minimal example can be found at ./demo/minimal_example.py.
- Import dependencies
import dash
from dash import html
import dash_tvlwc- Make some random candlestick data and line plot data
candlestick_data = [
    {'close': 97.56, 'high': 101.29, 'low': 95.07, 'open': 100, 'time': '2021-01-01'},
    {'close': 96.06, 'high': 99.06, 'low': 95.17, 'open': 97.56, 'time': '2021-01-02'},
    {'close': 92.06, 'high': 98.39, 'low': 90.72, 'open': 96.06, 'time': '2021-01-03'},
    {'close': 95.74, 'high': 97.87, 'low': 89.75, 'open': 92.06, 'time': '2021-01-04'},
    {'close': 92.44, 'high': 97.5, 'low': 88.56, 'open': 95.74, 'time': '2021-01-05'},
    {'close': 89.31, 'high': 93.1, 'low': 85.20, 'open': 92.44, 'time': '2021-01-06'},
    {'close': 85.10, 'high': 93.08, 'low': 82.23, 'open': 89.31, 'time': '2021-01-07'},
    {'close': 81.87, 'high': 88.34, 'low': 77.97, 'open': 85.10, 'time': '2021-01-08'},
    {'close': 79.55, 'high': 82.44, 'low': 76.08, 'open': 81.87, 'time': '2021-01-09'},
    {'close': 82.74, 'high': 84.01, 'low': 78, 'open': 79.55, 'time': '2021-01-10'}
]

line_data = [
    {'time': '2021-01-01', 'value': 100.35},
    {'time': '2021-01-02', 'value': 97.09},
    {'time': '2021-01-03', 'value': 95.74},
    {'time': '2021-01-04', 'value': 98.72},
    {'time': '2021-01-05', 'value': 100.3},
    {'time': '2021-01-06', 'value': 95.8},
    {'time': '2021-01-07', 'value': 91.22},
    {'time': '2021-01-08', 'value': 94.26},
    {'time': '2021-01-09', 'value': 94.9},
    {'time': '2021-01-10', 'value': 94.85}
]- Initialize Dash app and add the Tvlwc component
app = dash.Dash(__name__)
app.layout = html.Div(children=[
    dash_tvlwc.Tvlwc(
        seriesData=[candlestick_data, line_data],
        seriesTypes=['candlestick', 'line'],
    ),
])

if __name__ == '__main__':
app.run_server()- Run the app by
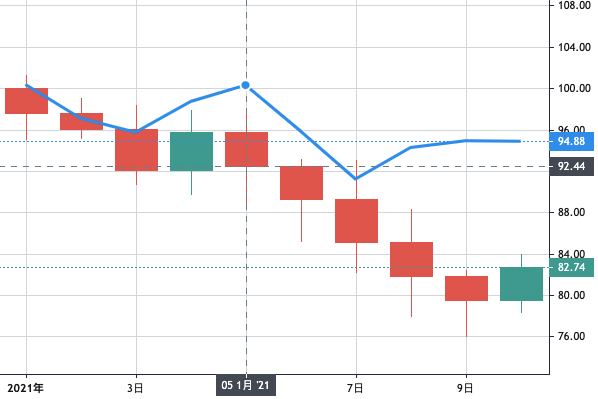
python minimal_example.py. The app should be running onlocalhost:8050/. You should see the plot:

References: Chart properties
The Tradingview Lightweight Chart library is highly customizable in style. For the complete list of chart options and series options available, please refer to the official API documentation.
Configurable props
| Property | Description |
|---|---|
chartOptions | a dict of options on chart canvas. |
seriesData | a list series of list of timepoint dicts on series data. |
seriesTypes | a list of series types, in the same order as seriesData. |
seriesOptions | a list of series option dict for each series, in the same order as seriesData. |
seriesMarkers | a list of list of markers dicts for each series, in the same order as seriesData. |
seriesPriceLines | a list of list of price line dicts for each series, in the same order as seriesData. |
width | width of outer container of the chart. |
height | height of outer container of the chart. |
Read-only props
| Property | Description |
|---|---|
id | identifiable ID for the chart. |
crosshair | position of last mouse hover on chart (crosshair coordinates). |
click | position of last mouse click on chart (click coordinates). |
fullChartOptions | full dict of applied chart options including default options. |
fullPriceScaleOptions | full dict of applied series options including default options. |
timeRangeVisibleRange | from-to dates of visible time range. |
timeRangeVisibleLogicalRange | from-to numbers of visible time range. |
timeScaleWidth | width of time scale. |
timeScaleHeight | height of time scale. |
fullTimeScaleOptions | full dict of applied time scale options including default options. |
Contributing
See CONTRIBUTING.md
Development
- Install Dash and its dependencies: https://dash.plotly.com/installation
- Run demonstration script with
python example/usage.py - Visit the demo Dash app at http://localhost:8050 in your web browser
Install dependencies
If you have selected install_dependencies during the prompt, you can skip this part.
- Install npm packages
$ npm install Create a virtual env and activate.
$ virtualenv venv
$ . venv/bin/activate
Note: venv\Scripts\activate for windows
Install python packages required to build components.
$ pip install -r requirements.txt- Install the python packages for testing (optional)
$ pip install -r tests/requirements.txt