epiviz.scatter.gl v0.0.5
epiviz.scatter.gl
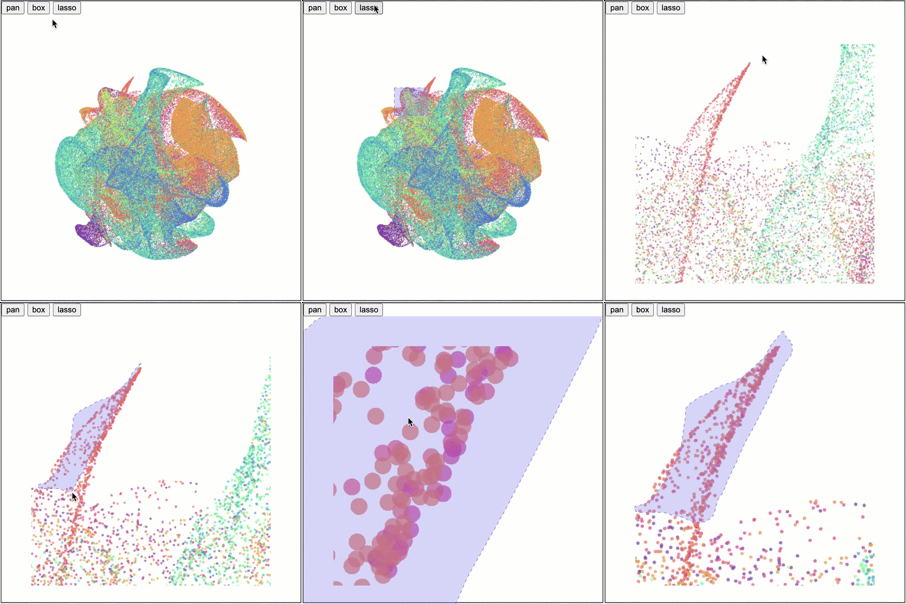
A fast and scalable WebGL2 based rendering library for visualizing scatter/dot plots. The library uses epiviz.gl under the hood and provides an easier interface for use in various applications.
Internally, the library creates two WebWorkers
- data worker: indexes the data points using flatbush
- webgl worker: all the rendering magic happens here
epiviz.gl uses OffScreenCanvas to delegate rendering to a worker. since the main thread of the browser is less busy, this provides a fluid, high-performance user experience for applications.

Getting started
Installation
package is available through npm
npm install epiviz.scatter.glUsage
- app/index.html provides an easier example and code on how to use the library
- If you want to use the library in a react app, check usage in Kana
Simple usage:
    import ScatterGL from "epiviz.scatter.gl";

    # you can either pass in a dom selector or HTMLElement
    let plot = new ScatterGL(".canvas");

    # provide input data to the element,
    # data must contain x and y coordinates
    plot.setInput({
        x: [...],
        y: [...],
    });

    # render the plot
    plot.render();
Advanced Usage
The library provides methods to capture events and modify attributes -
Interaction modes
Supports three modes
pan- no selection, pan (drag)/zoom (wheel) the canvasbox- box selections, no pan but allows zoom (wheel)lasso- same as box, no pan but allows zoom (wheel)
setInteraction(mode);Events
- hoverCallback
- clickCallback
- selectionCallback
hover and click also provide the distance of the point from the mouse location. This metric can be used to enable various interactions.
plot.hoverCallback = function (point) {
  if (point) {
    //   use some threshold (1.5)
    if (point.distance <= 1.5) {
      console.log(`${point} is closest`);
    }
  }
};

plot.selectionCallback = function (points) {
  // ... do something ...
  console.log(points);
};
Encodings
checkout the example for Iris dataset
These attributes either take a fixed value or an array of values for each data point.
- colors - color/rgb/hex code
- size - size of each dot
- opacity - opacity across the entire plot
- shape - supports, circles, triangle and squares
  plot.setState({
    size: <SIZE>
    color: <COLOR>
    shape: <SHAPE>,
    opacity: <OPACITY>
  });