express-internal-monitor v1.1.2
express-internal-monitor
Monitoring internal expressjs functions such as Handles and Router and connect resource to InfluxDB
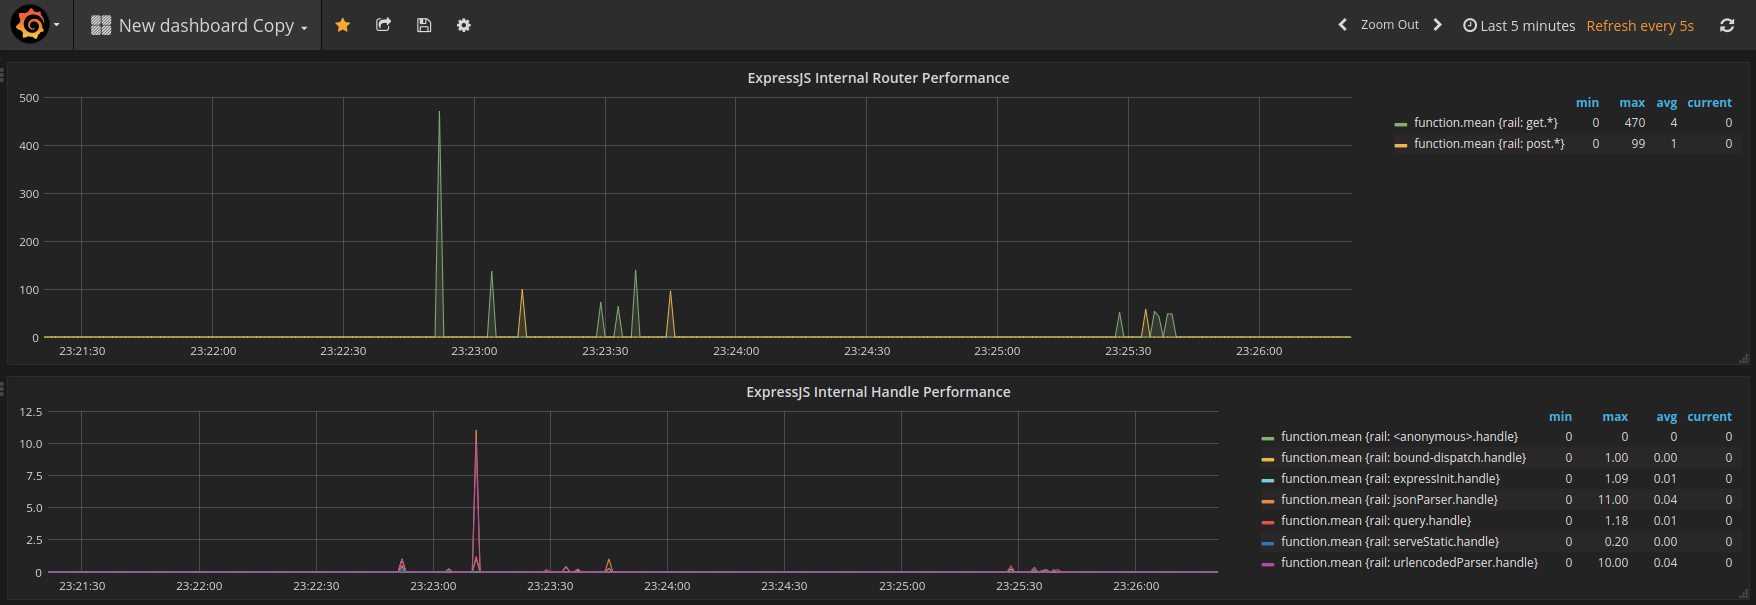
The middleware express-internal-monitor allows to trace and record performance measurements of expressjs's internals Handles and Layers (Router). Data points are stored in a plaintext file but the tool can send these points to InfluxDB and then it is possible to monitor the Express Application Server with Grafana.

Example Configuration
const express = require('express')
const expressInternalMonitor = require('express-internal-monitor')

var app = express()

// initialize the monitor
expressInternalMonitor(app, {
  // optionnal
	influxDB: {
		url: 'http://localhost:8086',
		db: 'monitor'
	}
});

// static handle
app.use(express.static(__dirname + '/static'));

// slow route
app.get('/next', function (req, res) {
	setTimeout(() => {
		res.send('Hello World! next')
	}, 1000)
})

app.get('/', function (req, res) {
	res.send('Hello World!')
})

app.listen(3000, function () {
	console.log('Example app listening on port 3000!')
})
Out of the box you will get statistics for:
- Internal Handle measurement
- Internal Router measurement (per Layer)
Two examples are available in test1.json and test2.json
Configuration Options
const expressInternalMonitor = require('express-internal-monitor')

// initialize the monitor
expressInternalMonitor(app, {
  // optionnal
	influxDB: {
		url: 'http://localhost:8086',
		db: 'monitor'
	}
});
In the example expressInternalMonitor(app, options) takes the ExpressJS's Application pointer and options.
Options are:
- path: Change working path. Default to current working path
- influxDB: Setup InfluxDB options (see bellow)
- logFile: Activate file logging for data points (default true)
- statHandle: Activate statistics for ExpressJS Handles (default true)
- statRouter: Activate statistics for ExpressJS Router (default true)
- serverName: Set current server name
For influxDB options are:
- url: InfluxDB URL for example http://user:pass@localhost:8086..
- db: Database to store data points
- concurrent: Amount of concurrent insertion of data points, default to 2000
- heartbeat: Setup application heartbeat, default to true
- heartbeatTimer: Set application heartbeat timer in milliseconds, default to 1000 (1 second)
InfluxDB Integration
A database must be created in order to store data points.
Connect to your InfluxDB administration interface (example: http://localhost:8083/) and create a new database calls monitor:
CREATE DATABASE "monitor"If you running InfluxDB > v1.3 use the CLI to create the database:
influx -precision rfc3339Grafana Integration
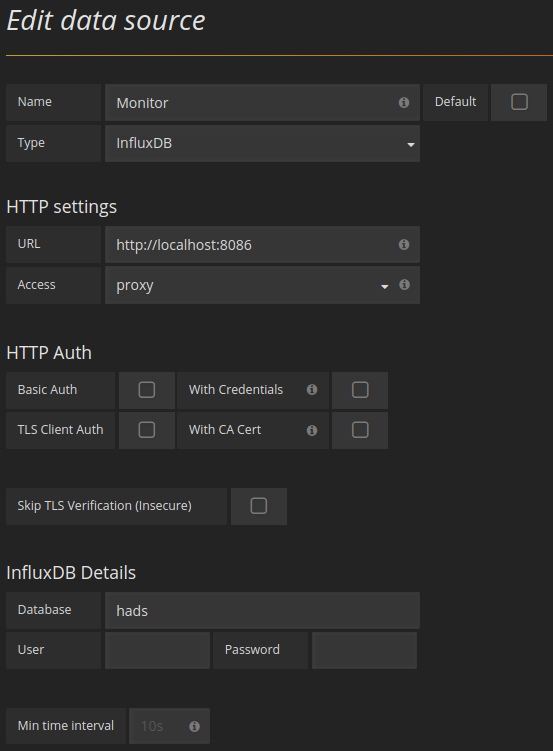
- First add your InfluxDB data source in Grafana and goto Administration > Data Sources
- Fill informations as following (working example)

- Goto new Import Dashboard
- Paste the grafana.json data (or upload it)
- Well done!
Credits
Package under MIT license