foggshark v1.0.3
FoggShark
Get an overview of what a system connects to just by running tcpdump on one or more machines on the network.

Collecting tcpdump data
On as many servers as you want, run this command for a long as you want. The more servers and time, the more detailed the graph.
sudo tcpdump -nnl 'tcp[13] == 2' | perl -ne '$|=1;/([\d.]+)\.(\d+) > ([\d.]+)\.(\d+)/;$f=$1;$t=$3;$p=$4;if($4>30000){$f=$3;$t=$1;$p=$2;}$o="$f>$t:$p\n";if(!$s{$o}){$s{$o}=1;print$o;}'> `hostname`.logThe command above runs tcpdump configured to report only new connections and pipes it to a perl script to format the output nicely and remove duplicates.
Drawing the graph
You need nodejs and npm, then run:
npm install -g foggsharkDownload the log files from all the machines into one directory and run
cat *.log | foggsharkWait for the script to finish looking up the DNS entries for the hosts and then open http://127.0.0.1:8000 where your graph should be waiting. To disable DNS lookups (which can take some time) use foggshark -n
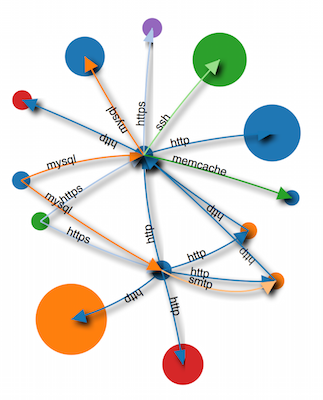
You can move around nodes on the graph to see things better. The hosts in the graph are grouped such that hosts which connect only to one other host on the same port are grouped together by port. Mouse over the nodes to reveal which hosts are in the group. The links are colour coded by port and the size of nodes reflects the number of hosts in the group.