grafana-darksky v1.0.2
DarkSky Datasource - weather and forecast data for Grafana
This plugin allows to graph historic weather conditions and forecast data as returned by the DarkSky API.

Requirements
API key
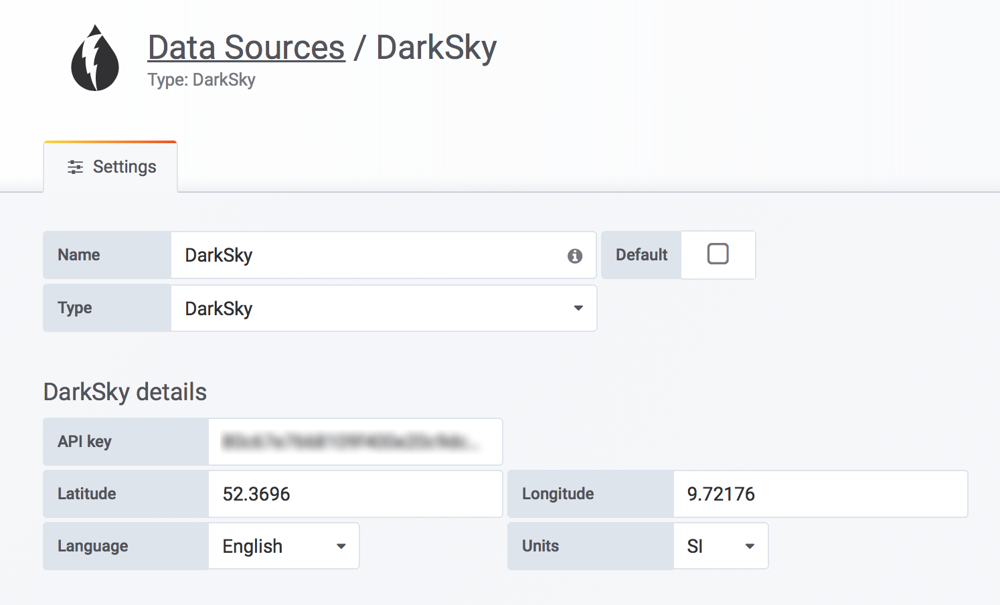
Register for a DarkSky API key at DarkSky. The free plan will allow 1000 API calls per day.
Geo location
Weather data will be available for the location defined when creating the data source. If unsure you can always use Google Maps or IP location APIs like ipgeolocation.io.
Configuration
Example configuration:

Frequently asked questions
I've selected a metric- why does it not appear at certain zoom levels?
The DarkSky API offers different data nodes, e.g. hourly and daily data. Not all metrics are available on all levels. During selection, this datasource offers all metrics available on any level of DarkSky data. If in doubt which metric to choose please take a look at the raw DarkSky API response.
Development
Using Docker:
- Clone the repo and cd into the folder grafana-darksky
- make sure you have yarn installed
- install the project dependencies:
yarn install - Start the watch task with yarn:
yarn watch - run the docker from the docker compose file with:
docker-compose -f "docker-compose.yml" up -d --build - Open grafana at http://localhost:3000
- Login with "admin" and password "admin"
- Now you can get started
