hexo-graphviz-tag v1.1.1
hexo-tag-graphviz
A hexo plugin to add graphviz graphs in hexo blog using tags.
In the process of blogging, sometimes you need to draw pictures. For example, when writing a blog related to graph theory, you need to draw a directed or undirected graph. Using graphviz is a good choice.
This plugin allows users to write dot language directly in the blog, without having to write locally and then generate pictures.
Instructions
installation method:
npm i hexo-graphviz-tagIt was originally called hexo-tag-graphviz, but when it was released, it was found that hexo-tag-graphviz already existed, so it was renamed to hexo-graphviz-tag, so the name on github is different from the name on npm.
After the installation is complete, you can use it the same as the general hexo tag plugin. The label plugin has three parameters, namely title, align and maxWidth.
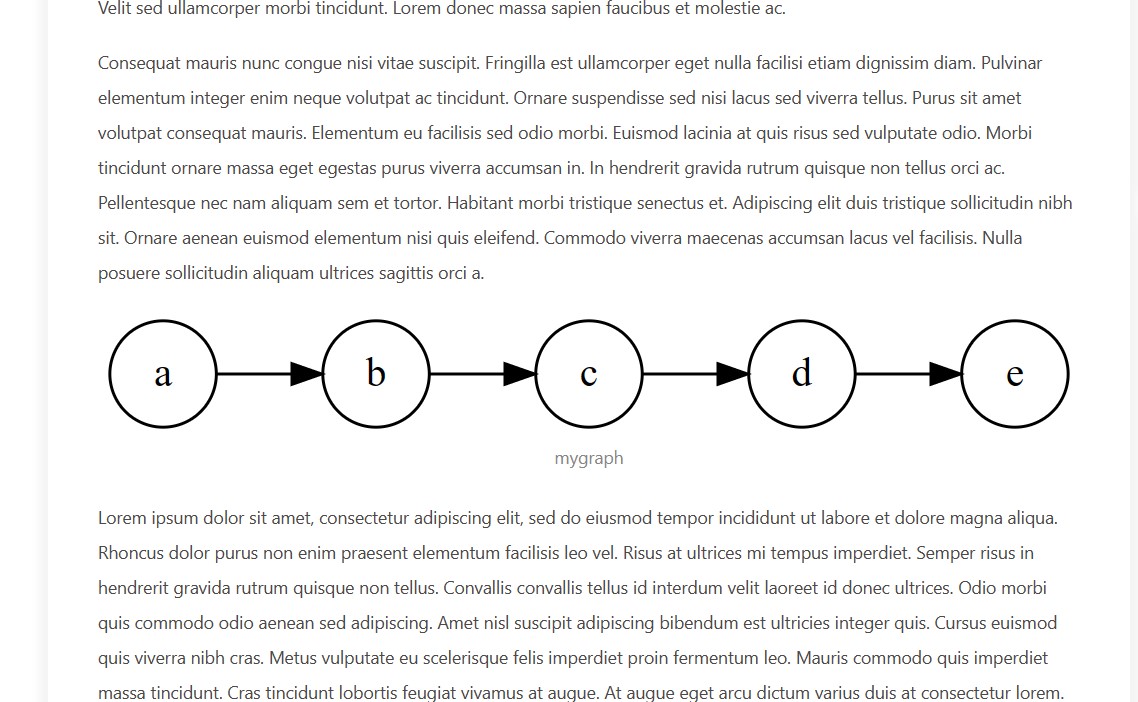
If only one anonymous argument is provided, it defaults to the image title title, as shown below, defining a directed graph named mygraph.
{% graphviz mygraph %}
digraph {
   rankdir = LR;
   node [shape=circle]
   a -> b;
   b -> c;
   c -> d;
   d -> e;
}
{% endgraphviz %}
The display effect under the butterfly theme:

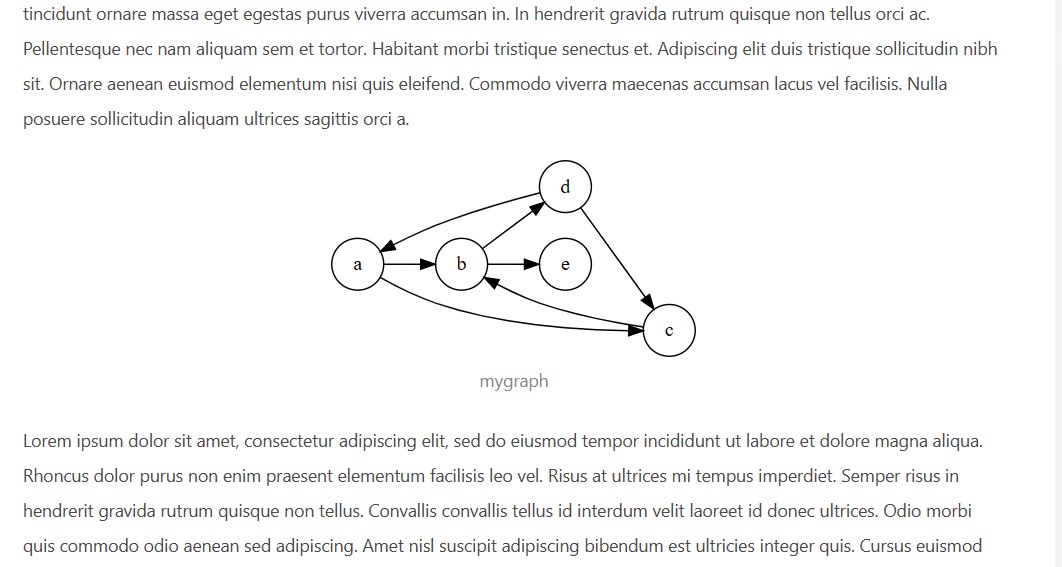
maxWidth can set the maximum width. The default unit is px. As shown below, a directed graph with a maximum width of 300px is defined.
{% graphviz title:mygraph maxWidth:300 %}
digraph {
   rankdir = LR;
   node [shape=circle]
   a -> b;
   b -> d;
   c -> b;
   d -> a;
   d -> c;
   a -> c;
   b -> e;
}
{% endgraphviz %}
The
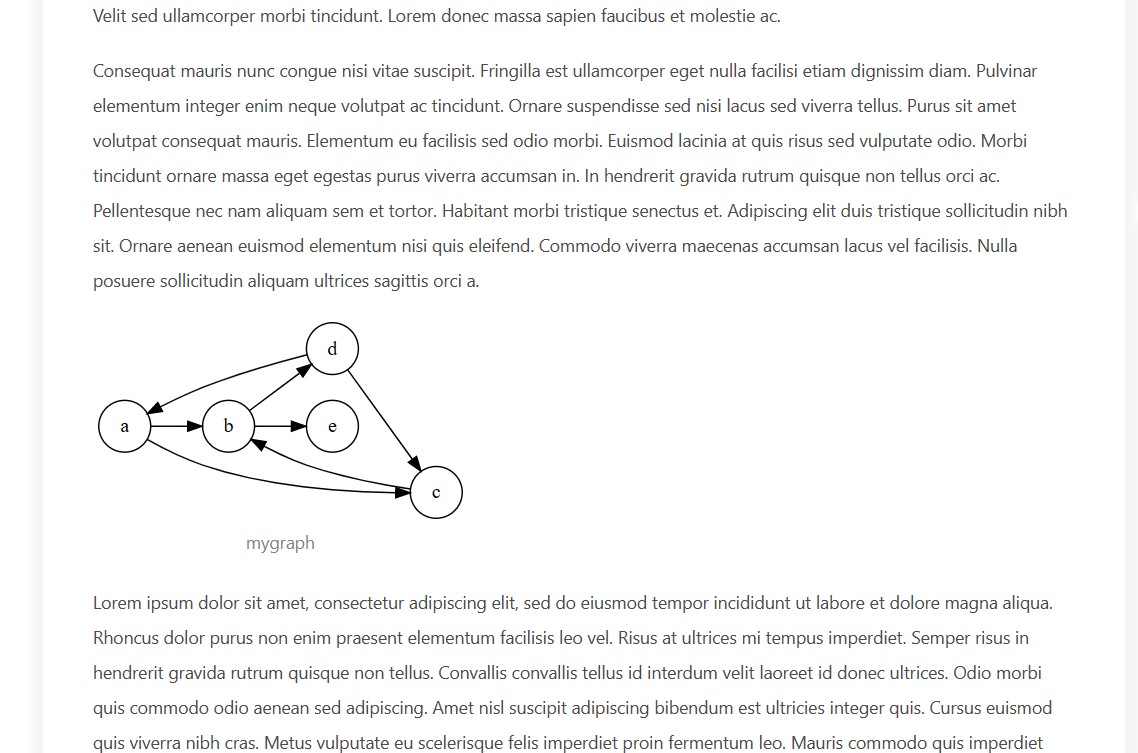
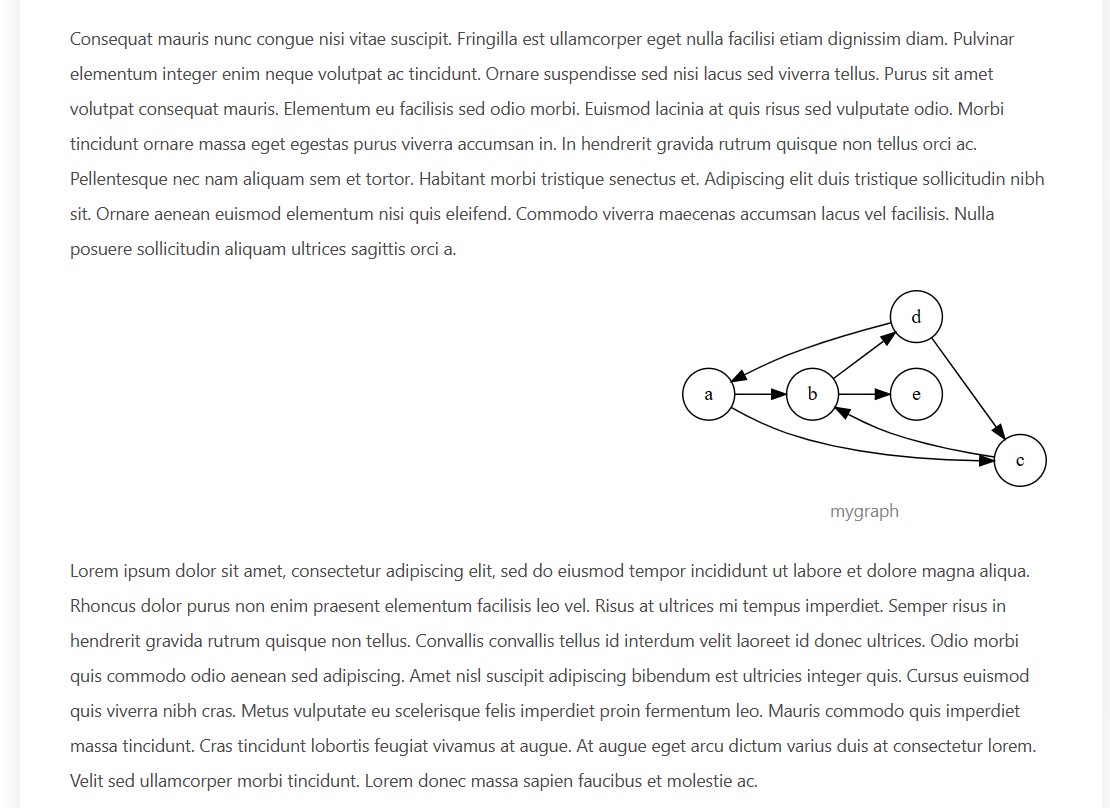
The align parameter can set the alignment of the image. There are three alignment methods, namely center, left and right, where center is the default alignment.
Align left:
{% graphviz title:mygraph maxWidth:300 align:left %}
digraph {
   rankdir = LR;
   node [shape=circle]
   a -> b;
   b -> d;
   c -> b;
   d -> a;
   d -> c;
   a -> c;
   b -> e;
}
{% endgraphviz %}
Align right:
{% graphviz title:mygraph maxWidth:300 align:left %}
digraph {
   rankdir = LR;
   node [shape=circle]
   a -> b;
   b -> d;
   c -> b;
   d -> a;
   d -> c;
   a -> c;
   b -> e;
}
{% endgraphviz %}