1.5.0 • Published 3 years ago
lelechart v1.5.0
LeleChart
LeleChart is a React chart library that enables you to create custom charts for your applications.

Quick Start
npm i lelechartInitial setup
import { Chart, CfgType } from 'lelechart'Create a variable with the configurations.
 const cfg: CfgType = {
  dimensions: {
    maxWidth: 1200, // maxWidth: number
    maxHeight: 600, // maxHeight: number
    paddingX: 40, // paddingX: number
  },
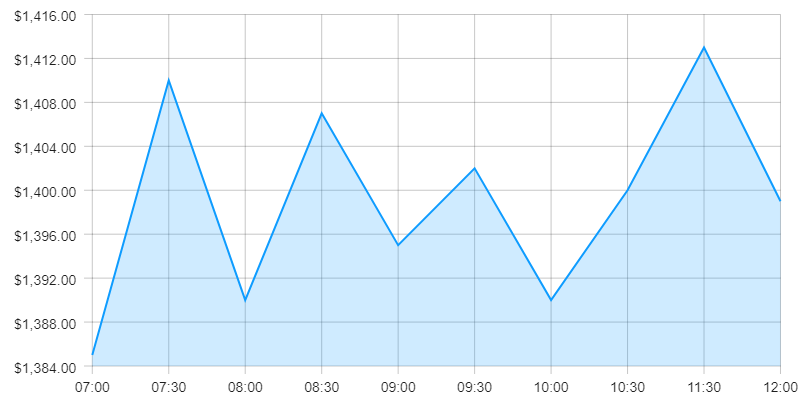
  data: [
      { x: '07:00', y: 1385 }, // { x?: string | number; y: number }
      { x: '07:30', y: 1410 },
      { x: '08:00', y: 1390 },
      { x: '08:30', y: 1407 },
      { x: '09:00', y: 1395 },
      { x: '09:30', y: 1402 },
      { x: '10:00', y: 1390 },
      { x: '10:30', y: 1400 },
      { x: '11:30', y: 1413 },
      { x: '12:00', y: 1399 },
  ],
  // dataFormat?:  | 'USD'| 'EUR' | 'JPY' | 'GBP' | 'AUD' | 'CHF' | 'CAD' | 'CNY' | 'SEK' | 'NZD' | 'BRL' | 'RUB' | 'INR' | 'MXN' | '%' | 'º'
  dataFormat: 'USD',
  lineWidth: 2, // lineWidth?: number
  color: '#0e9cff', // color?: string
  animation: { // optional
    isEnable: true, // isEnable: boolean
    speed: 4, // speed: number - min 1 max 10
  },
  backgroundColor: '#fff', // backgroundColor?: string
  fill: { // optional
    display: true, // display: boolean
    color: '#0e9cff33', // color: string
  },
  tooltip: { // optional
    fontFamily: 'Arial', // fontFamily?: string
    fontSize: '14px', // fontSize?: string
    color: '#1e1e1e', // color?: string
    borderRadius: '8px', // borderRadius?: string
    backgroundColor: '#1e1e1e33', // backgroundColor?: string
  },
  responsive: true, // responsive?: boolean
  x: { // optional
    label: { // optional
      display: true, // display: boolean
      fontSize: '14px', // fontSize?: string
      fontFamily: 'Arial', // fontFamily?: string
      color: '#1e1e1e', // color?: string
      offset: 8, // offset?: number
    },
    grids: { // optional
      display: true, // display: boolean
      color: '#1e1e1e80', // color?: string
      lineWidth: 0.5, // lineWidth?: number
    },
    ticks: { // optional
      display: true, // display: boolean
      color: '#1e1e1e80', // color?: string
      lineWidth: 0.5, // lineWidth?: number
      length: 8, // length?: number
    },
  },
  y: { // optional
    label: { // optional
      display: true, // display: boolean
      fontSize: '14px', // fontSize?: string
      fontFamily: 'Arial', // fontFamily?: string
      color: '#1e1e1e', // color?: string
      offset: 8, // offset?: number
    },
    grids: { // optional
      display: true, // display: boolean
      color: '#1e1e1e80', // color?: string
      lineWidth: 0.5, // lineWidth?: number
    },
    ticks: { // optional
      display: true, // display: boolean
      color: '#1e1e1e80', // color?: string
      lineWidth: 0.5, // lineWidth?: number
      length: 8, // length?: number
    },
  },
}
Call the component passing the configurations.
<Chart {...cfg}/>