matrx-radar v0.1.3
MatrX-Radar
What is it?
MatrX-Radar is a radar visualization component.

How to use
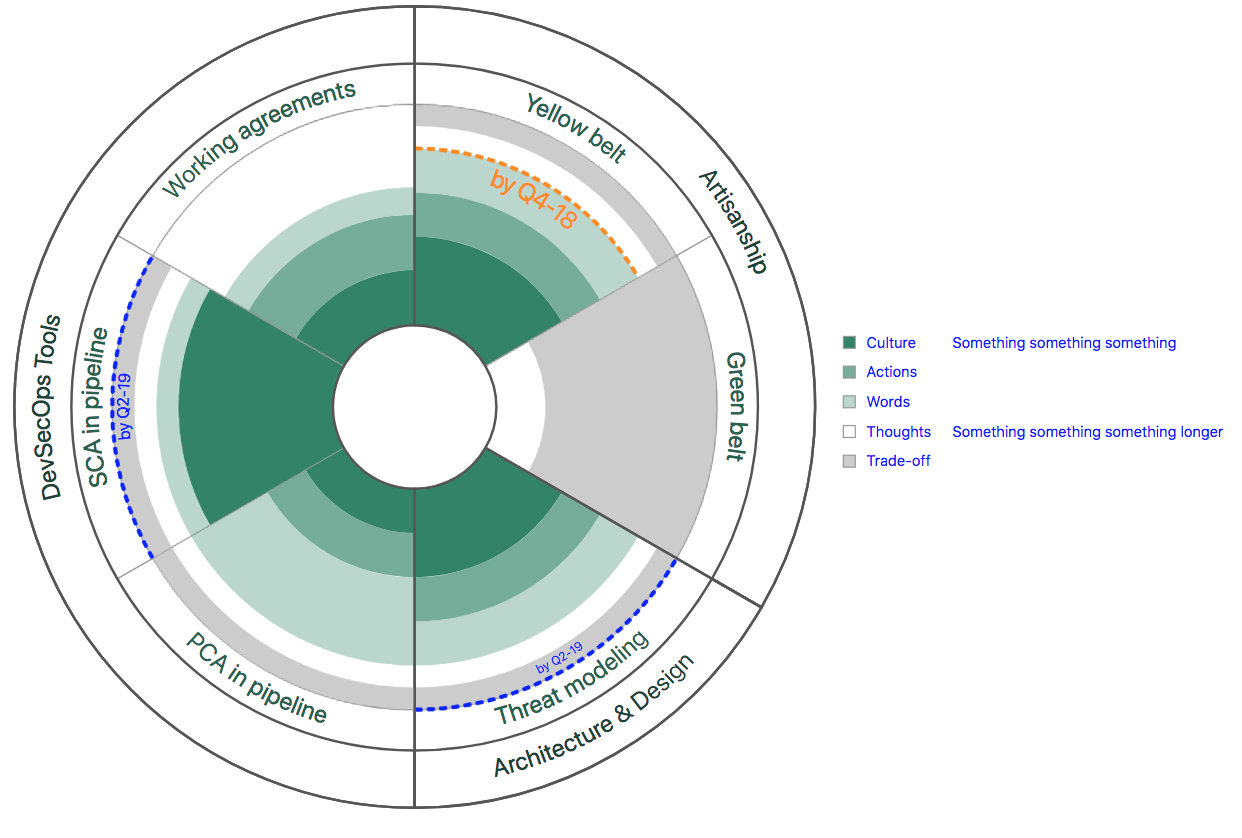
For the chart that is shown above, here is data that was used:
disciplines: [
  {
    discipline: "Artisanship",
    practices: [
      {practice: "Yellow belt", description: "100% of group members... Yellow Belt training", levels: [
        {portion: 4},
        {portion: 2},
        {portion: 2},
        {portion: 1},
        {portion: 1},
      ]},
      {practice: "Green belt", description: "At least one Green Belt...", levels: [
        {portion: 0},
        {portion: 0},
        {portion: 0},
        {portion: 2},
        {portion: 7},
      ]},
    ]
  },
  {
    discipline: "Architecture & Design",
    practices: [
      {practice: "Threat modeling", description: "blah blah", levels: [
        {portion: 4},
        {portion: 2},
        {portion: 2},
        {portion: 1},
        {portion: 1},
      ]},
    ]
  },
  {
    discipline: "DevSecOps Tools",
    practices: [
      {practice: "PCA in pipeline", description: "blah, blah", levels: [
        {portion: 2},
        {portion: 2},
        {portion: 4},
        {portion: 1},
        {portion: 1},
      ]},
      {practice: "SCA in pipeline", description: "blah, blah", levels: [
        {portion: 7},
        {portion: 0},
        {portion: 1},
        {portion: 1},
        {portion: 1},
      ]},
      {practice: "Working agreements", description: "blah, blah", levels: [
        {portion: 2},
        {portion: 2},
        {portion: 1},
        {portion: 3},
        {portion: 0},
      ]},
    ]
  },
]
The discipline is the outermost layer and groups together different practices. Each practice has a label and a description, although description is not currently used for anything. Each practice also has any number of layers, and each layer has a portion which represents the size of the corresponding arc. Portions may be given in percentages or in numbers and are later calculated to be a proportion of sum of the portions. The first level/portion listed is represented by the dark green color. As the levels/portions progress, the transparency of the levels increase and the last portion will be represented by a white arc. We also allow for customization of these levels, including the individual colors.
To the right of the radar visualization we have added a legend that automatically matches the colors of the levels for the key, and allows for a label and description. We autosize the text so that it fits, and we also restrict the maximum size of the font to be the size of the discipline font.