node-red-contrib-nodes-memory v0.0.1-beta.1
node-red-contrib-nodes-memory
A node-red node to analyse the memory consumption of the nodes.
CAUTION: this node hasn't been published on NPM, since it has to much limitations (see below)!!! I will keep it here on Github, in case someone else might be wondering why this kind of functionality isn't available in Node-RED...
Install
Run the following npm command in your Node-RED user directory (typically ~/.node-red):
npm install node-red-contrib-nodes-memory@0.0.1-beta.3See the related discussion on the Node-RED forum for more information about this beta version...
Node Usage
The main purpose of this node is to show the current memory consumption of each selected Node-RED node. This should simplify memory analyses, e.g. to track memory leaks.
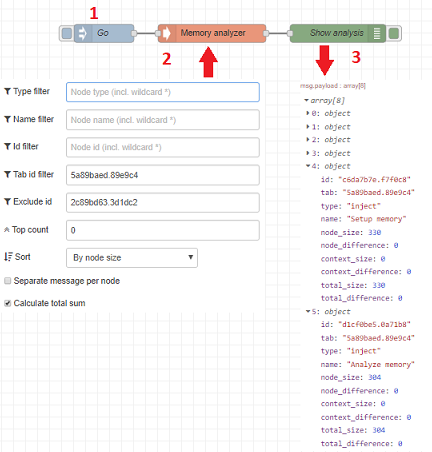
The following example flow explains how this node works:

- Every time an input message is injected, the memory-analyzer node will analyze all specified nodes. Adjust the frequency of the inject node to find the optimal number of analysis that fits your needs.
- In the memory-analysis node you can specify (based on a series of filters) which nodes need to be analysed.
- For every analysis, one or more output messages will be send (depending on the node configuration).
Limitations

This node is still in beta phase, since it has currently a large number of limitations:
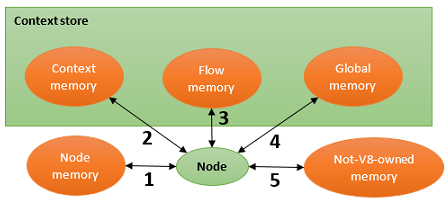
1. Each node has its own node memory, by storing data in this.someVariable or node.someVariable. For most nodes the size of that data can be calculated, however not for all nodes: e.g. the function node (and some similar contributions) run in a NodeJS sandbox, so this refers to the sandbox instance (and not the function node itself). See this discussion for more information.
1. Some nodes might store data in local variables, and use it via closures:
function MyCustomNode() {
   var someVariable = 'data';

   function someNestedFunction() {
      // use someVariable declared in the parent function
   }
}
The local variable can be used by all nested functions, but it cannot be accessed from outside. So there is no way to determine the size of that data...
1. Each node has its own context memory, which cannot be measured at the moment. Extra node.getSize functionality in the core of Node-RED might make this possible?
1. All nodes can write in the same flow memory, so there is no way to determine which flow memory is used by which node. This functionality can never be implemented.
1. All nodes can write in the same global memory, so there is no way to determine which global memory is used by which node. This functionality can never be implemented.
1. Some nodes can use memory outside NodeJs, which is called memory not-owned by the V8 engine (which is the runtime platform for NodeJs). For example an image-processing node based on OpenCv (C++) can use very little V8 owned memory, but it can use a massive amount of memory which NodeJs is not aware of. Don't think there is a general solution for this problem ... Only workaround might be that each node is somehow able to extend the node.getSize to return the extra used memory?
1. This node is based on the object-sizeof node, which doesn't explain how the memory is calculated. So the calculated size 'might' be not very accurate in some (edge) cases...
Node configuration
Filters
A number of different filters are available, to specify which nodes need to be analyzed:
- Type filter: only the nodes with the specified type(s) will be analyzed.
- Name filter: only the nodes with the specified names(s) will be analyzed.
- Id filter: only the nodes with the specified id(s) will be analyzed.
- Tab id filter: only the nodes located on the specified tab id(s) will be analyzed.
- Exclude id filter: the nodes with the specified id(s) won't be analyzed. E.g. specify the id of this memory-analysis node itself, if you don't want this node to be included in the analysis result.
Note that in all filters wildcards ()* can be used.
Top count
Limit the output to only the specified number of nodes. Note that nodes with the largest memory size will appear in the analysis result (even when other sorting algorithms are used). When no value or 0 value is specified, then all nodes (that fullfill all the specified filter criteria) will be analyzed.
Sort
Sort the output node list by one of the following properties:
- By node name.
- By node type.
- By node memory size (descending).
Separate message per node:
When selected, a separate message will be send for every analyzed node. When not selected, a single message will be send (which contains an array with memory information of all the analyzed nodes).
Calculate total used memory
When selected, the total memory of all specified nodes will be summed. This calculation doesn't take into account the 'Top N' setting, so all nodes (that match the specified filters) will be used for the sum! An extra line will be added to the array of nodes, with id = 'total_sum'.