0.2.7 • Published 3 years ago
pg-board v0.2.7
Introduce
一个使用Vue3.0轻度封装的图表组件库,其中包含基础的布局组件和图表组件
Install
npm install pg-board -SQuick Start
import { createApp } from 'vue';
import App from './App.vue';
import board from 'pg-board'

const app = createApp(App)
app.use(board)
单文件引用
<script src="vue.min.js"></script>
<script src="echarts.min.js"></script>
<script src="board.umd.js"></script>

<script>
const app = createApp(App)
app.use(board)
</script>
Doc
PgLayout 看板布局
| 参数 | 说明 | 类型 | 可选值 | 默认值 |
|---|---|---|---|---|
| gutter | 布局中每个小看板水平之间的间隔 | number | 0 | |
| yGutter | 布局中每个小看板垂直之间的间隔 | number | 0 | |
| theme | 看板主题 | number | 1/2/3 | 0(代表无) |
PgBoard 小看板
| 参数 | 说明 | 类型 | 可选值 | 默认值 |
|---|---|---|---|---|
| span | 水平方向占比 | number | 0=<x<=24 | 24 |
| ySpan | 垂直方向占比 | number | 0=<x<=24 | 24 |
| offset | 水平方向偏移 | number | 0=<x<=24 | 0 |
| yOffset | 垂直方向偏移 | number | 0=<x<=24 | 0 |
Example:
<pg-layout:gutter="20" :y-gutter="20">
    <pg-board :span="8" :y-span="8"></pg-board>
    <pg-board :span="8" :y-span="8" :y-offset="8"></pg-board>
    <pg-board :span="8" :y-span="8" :y-offset="16"></pg-board>
    <pg-board :span="8" :y-span="8" :offset="8"></pg-board>
    <pg-board :span="8" :y-span="8" :offset="16"></pg-board>
</pg-layout>
PgRow 行布局
| 参数 | 说明 | 类型 | 可选值 | 默认值 |
|---|---|---|---|---|
| span | 垂直方向行占比 | number | 一 | 24 |
| type | 布局模式,可选 flex,现代浏览器下有效 | string | flex | flex |
| justify | flex 布局下的水平排列方式 | string | flex-end|center|space-around|space-between | — |
| align | flex 布局下的垂直排列方式 | string | center|end | 一 |
PgCol 列布局
| 参数 | 说明 | 类型 | 可选值 | 默认值 |
|---|---|---|---|---|
| span | 列水平方向占比 | number | 一 | 24 |
| yspan | 列垂直方向占比 | number | 一 | 24 |
| offset | 列水平方向便宜 | number | 一 | 0 |
| yoffset | 列垂直方向便宜 | number | 一 | 0 |
Example:
<PgRow :span="24">
  <PgCol :span="12" :yspan="24"></PgCol>
  <PgCol :span="6" :offset="6"></PgCol>
</PgRow>
PgContainer 容器
| 参数 | 说明 | 类型 | 可选值 | 默认值 |
|---|---|---|---|---|
| direction | 子元素的排列方向 | string | horizontal|vertical | 子元素中有pg-header或pg-footer时为vertical,否则为horizontal |
PgHeader 容器头部
| 参数 | 说明 | 类型 | 可选值 | 默认值 |
|---|---|---|---|---|
| height | 头部高度 | string | 60px |
PgMain 容器主体
| 参数 | 说明 | 类型 | 可选值 | 默认值 |
|---|---|---|---|---|
| 一 | 一 | 一 | 一 | 一 |
PgFooter 容器脚部
| 参数 | 说明 | 类型 | 可选值 | 默认值 |
|---|---|---|---|---|
| height | 头部高度 | string | 60px |
Example:
<PgContainer>
  <PgHeader>
    <h2>Header</h2>
  </PgHeader>
  <PgMain>
  	<h2>Main</h2>
  </PgMain>
  <PgFooter>
  	<h2>Footer</h2>
  </PgFooter>
</PgContainer>
PgBox 图表容器
| 参数 | 说明 | 类型 | 可选值 | 默认值 |
|---|---|---|---|---|
| title | 标题内容 | string | 空 | |
| hasTitle | 是否有标题 | boolean | true|false | true |
PgBox Slot 图表容器插槽
| name | 说明 |
|---|---|
| title | 容器标题插槽 |
Example:
<PgBox style="height: 100%;background-color: #666" title="折线图">
  <template v-slot:title>
    <h2>通过插槽自定义标题样式</h2>
  </template>
  <PgChart cid="chart" type="line" :option="lineOption"></PgChart>
</PgBox>
PgTable 表格组件
| 参数 | 说明 | 类型 | 可选值 | 默认值 |
|---|---|---|---|---|
| head | 表头配置 | array | 空 | |
| data | 表格内容 | array | 空 | |
| headKey | 表头配置索引值 | string | key | |
| headName | 表头配置名称索引值 | string | name | |
| rowHeight | 表格行高 | string | 40px | |
| rowKey | 行的key值,用于优化表格渲染,应为每行数据唯一标识 | string | 空 |
<pg-table :head="head" :data="data" row-key="id"></pg-table>

<script>
	const head = [{
        key: 'name',
        name: '名称 '
    },{
        key: 'id',
        name: '标识'
    }]

    const data = [
        {
            id: 1,
            name: '张三'
        }
    ]
</script>
PgChart 图表组件
| 参数 | 说明 | 类型 | 可选值 | 默认值 |
|---|---|---|---|---|
| cid | 图表id,必须唯一 | string | 一 | 一 |
| type | 图表类型 | string | line|bar|pie|gauge|smallGauge|scatter|candlestick|radar|tree|sunburst|parallel|sankey|funnel | 一 |
| option | 图表配置,每个图表均有默认样式,如无需改变样式则传入图表内容即可,否则可传入图表样式配置。 | object | 类似如下配置:{} | 一 |
注:各图表的配置与echart配置相同,如果想定制特别的样式,可以根据echart官方文档的配置进行配置,传入配置会复写原有样式配置,下面列出比较常用的配置,如有复杂定制请参考echart官方文档。
let basicOption = {
  legend: {				//直角坐标系中的图例
    show: true,    //显示隐藏
    data: ['周一', '周二']     //图例内容
  },
  xAxis: { 				//直角坐标系中的 x 轴相关配置
    show: true,    //显示隐藏x轴
    type: 'category', //x轴数据类型 value|category|time|log 默认category
    data: ['周一', '周二'], //x轴数据内容
  },
  yAxis: { 				//直角坐标系中的 y 轴相关配置
    show: true,
    type: 'value', //y轴数据类型 value|category|time|log 默认value
  },
  series: [				//坐标系主体内容配置
    {
      data: [1, 2, 3, 4, 5, 6] //坐标系数据内容数组,每种图表的数据内容格式不太相同,可参考下方各个图表的示例
    }
  ]
}

//更多配置参考 https://echarts.apache.org/zh/api.html#echarts
Example:
line 折线图:

<template>
	<PgChart type="line" cid="line" :option="lineOption"></PgChart>
</template>

<script setup>
	let lineOption = {
    xAxis: {
      type: 'category',
      data: ['Mon', 'Tue', 'Wed', 'Thu', 'Fri', 'Sat', 'Sun']
    },
    yAxis: {
      type: 'value'
    },
    series: [
      {
        data: [150, 230, 224, 218, 135, 147, 260],
      }
    ]
  }
</>
bar 柱状图:
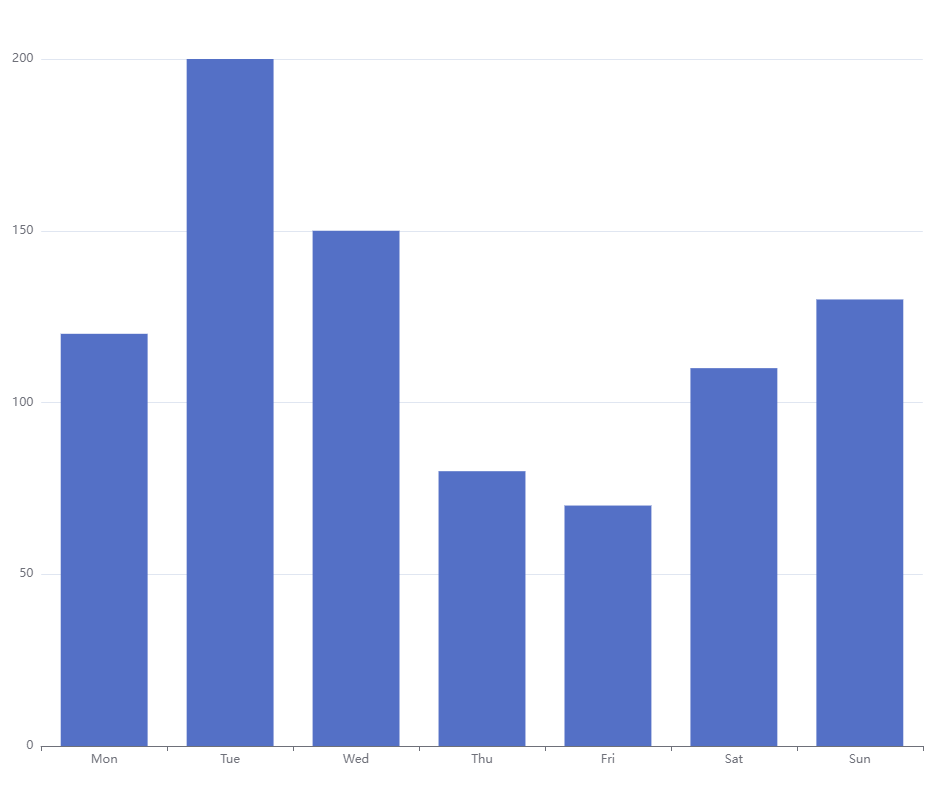
<template>
	<PgChart type="bar" cid="bar" :option="barOption"></PgChart>
</template>

<script setup>
	let barOption = {
    xAxis: {
      type: 'category',
      data: ['Mon', 'Tue', 'Wed', 'Thu', 'Fri', 'Sat', 'Sun']
    },
    yAxis: {
      type: 'value'
    },
    series: [
      {
        data: [150, 230, 224, 218, 135, 147, 260],
      }
    ]
  }
</script>
pie 饼图:
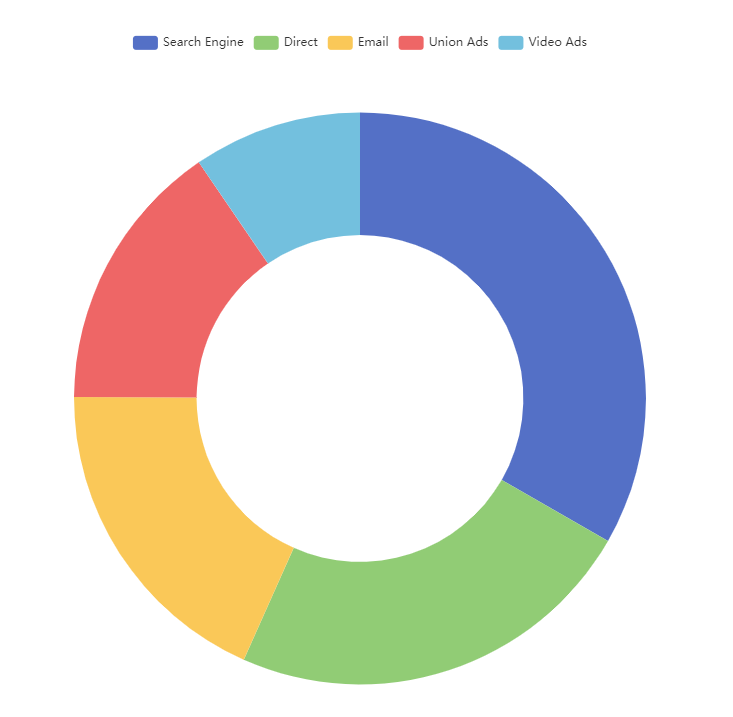
<template>
	<PgChart type="pie" cid="pie" :option="pieOption"></PgChart>
</template>

<script setup>
	let pieOption = {
    series: [
      {
        data: [
        { value: 1048, name: 'Search Engine' },
        { value: 735, name: 'Direct' },
        { value: 580, name: 'Email' },
        { value: 484, name: 'Union Ads' },
        { value: 300, name: 'Video Ads' }
        ],
      }
    ]
  }
</script>
gauge 仪表盘:
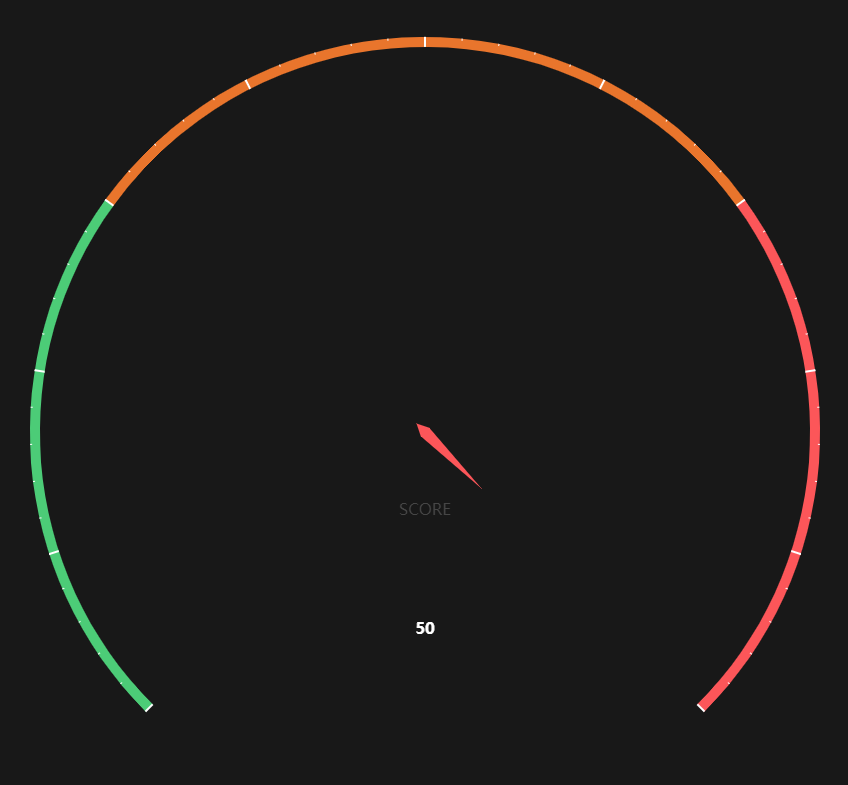
<template>
	<PgChart type="gauge" cid="gauge" :option="gaugeOption"></PgChart>
</template>

<script setup>
	let gaugeOption = {
    series: [
      {
        data: [
            {
                value: 0.2,
                name: 'SCORE'
            }
        ],
      }
    ]
  }
</script>
smallGauge 小仪表盘:
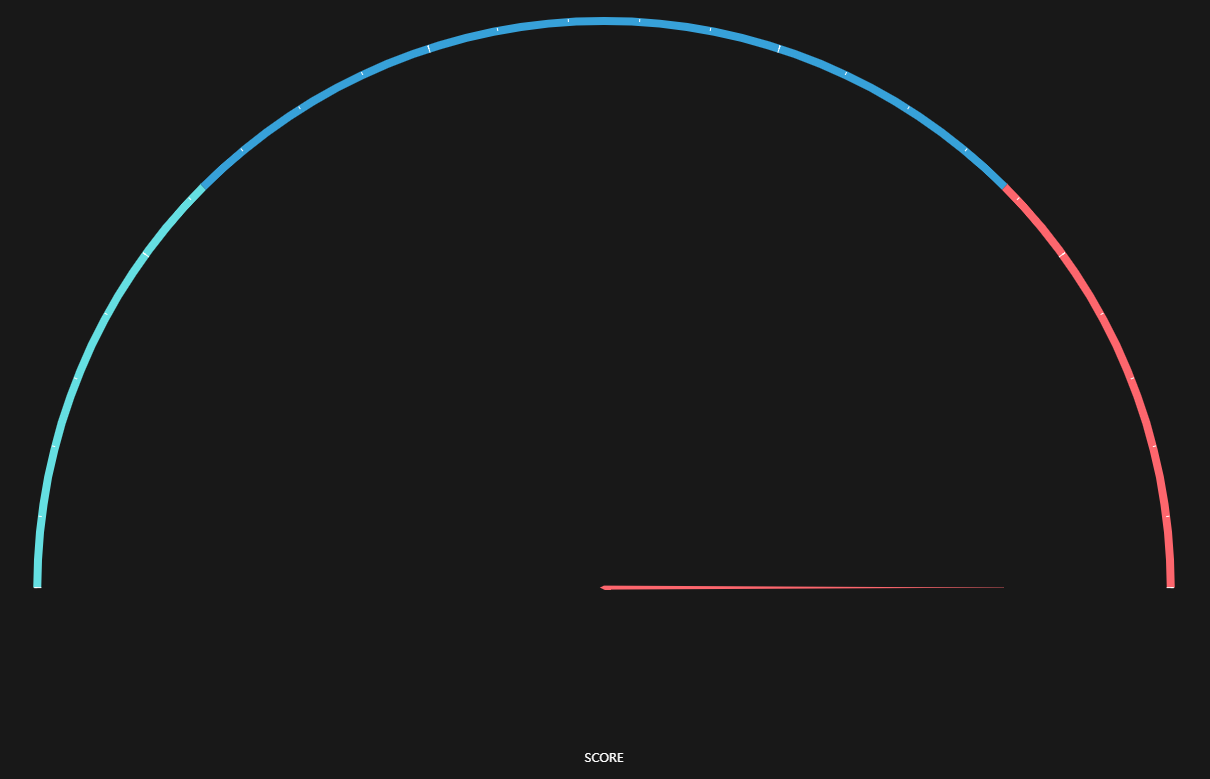
<template>
	<PgChart type="gauge" cid="gauge" :option="gaugeOption"></PgChart>
</template>

<script setup>
	let gaugeOption = {
    series: [
      {
        data: [
            {
                value: 0.2,
                name: 'SCORE'
            }
        ],
      }
    ]
  }
</script>
scatter 散点图:
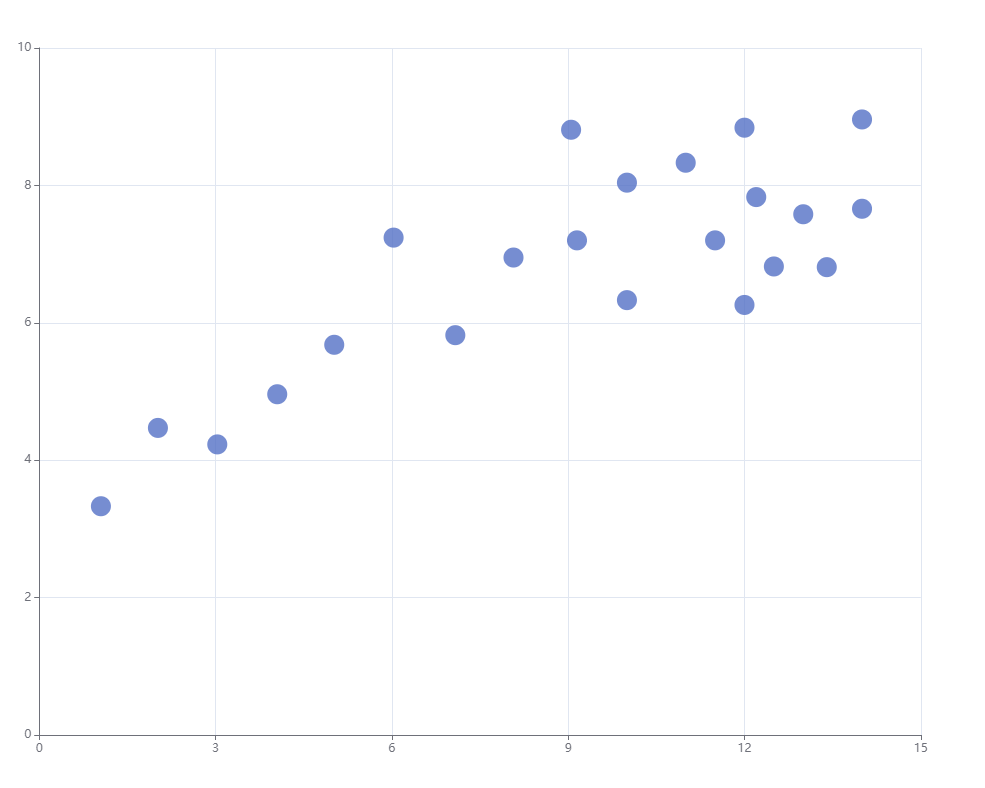
<template>
	<PgChart type="scatter" cid="scatter" :option="scatterOption"></PgChart>
</template>

<script setup>
	let scatterOption = {
    xAxis: {},
  	yAxis: {},
    series: [
      {
        data: [
          [10.0, 8.04],
          [8.07, 6.95],
          [13.0, 7.58],
          [9.05, 8.81],
          [11.0, 8.33],
          [14.0, 7.66],
          [13.4, 6.81],
          [10.0, 6.33],
          [14.0, 8.96],
          [12.5, 6.82],
          [9.15, 7.2],
          [11.5, 7.2],
          [3.03, 4.23],
          [12.2, 7.83],
          [2.02, 4.47],
          [1.05, 3.33],
          [4.05, 4.96],
          [6.03, 7.24],
          [12.0, 6.26],
          [12.0, 8.84],
          [7.08, 5.82],
          [5.02, 5.68]
        ],
      }
    ]
  }
</script>
candlestick K线图:
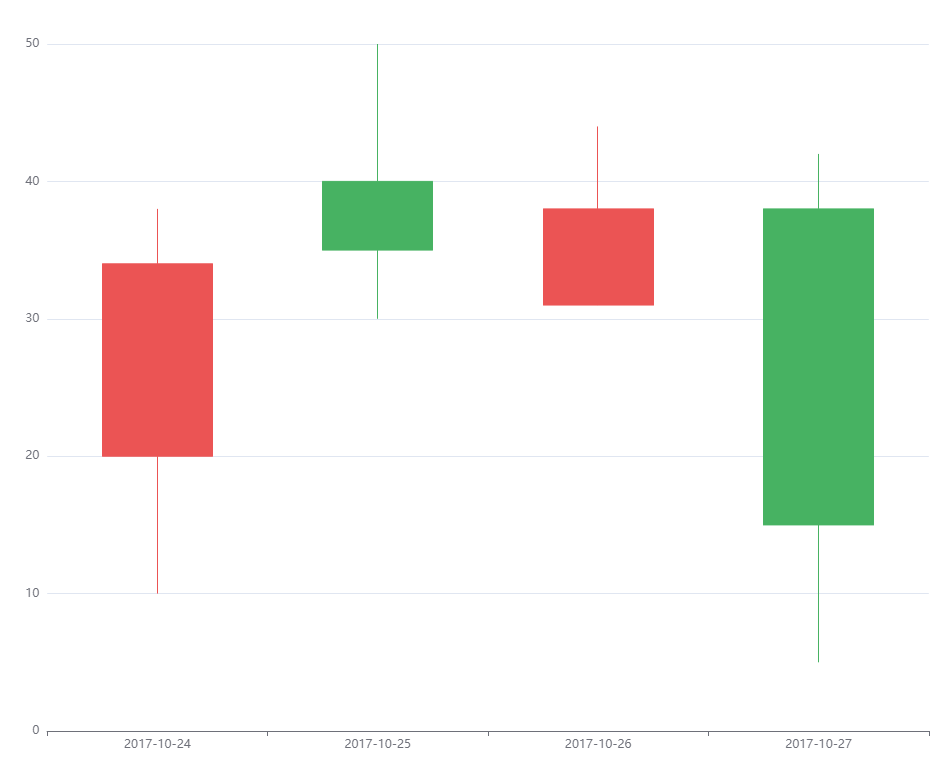
<template>
	<PgChart type="candlestick" cid="candlestick" :option="candlestickOption"></PgChart>
</template>

<script setup>
	let candlestickOption = {
    xAxis: {
      data: ["2017-10-24", "2017-10-25", "2017-10-26", "2017-10-27"],
    },
    yAxis: {},
    series: [
      {
        data: [
          [20, 34, 10, 38],
          [40, 35, 30, 50],
          [31, 38, 33, 44],
          [38, 15, 5, 42],
        ],
      },
    ],
  }
</script>
radar 雷达图:
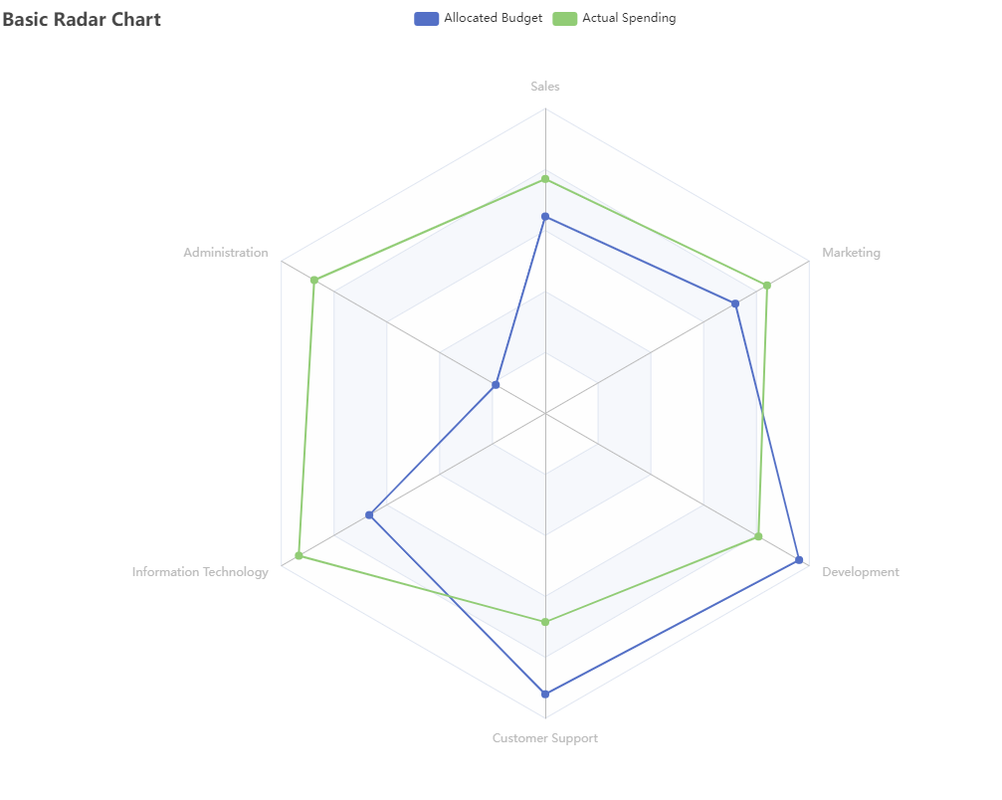
<template>
	<PgChart type="radar" cid="radar" :option="radarOption"></PgChart>
</template>

<script setup>
	let radarOption = {
     title: {
      text: '雷达图'
    },
    legend: {
      data: ['Allocated Budget', 'Actual Spending']
    },
    radar: {
      indicator: [
        { name: 'Sales', max: 6500 },
        { name: 'Administration', max: 16000 },
        { name: 'Information Technology', max: 30000 },
        { name: 'Customer Support', max: 38000 },
        { name: 'Development', max: 52000 },
        { name: 'Marketing', max: 25000 }
      ]
    },
    series: [
      {
        data: [
          {
            value: [4200, 3000, 20000, 35000, 50000, 18000],
            name: 'Allocated Budget'
          },
          {
            value: [5000, 14000, 28000, 26000, 42000, 21000],
            name: 'Actual Spending'
          }
        ]
      }
    ]
  }
</script>
sunburst 旭日图:
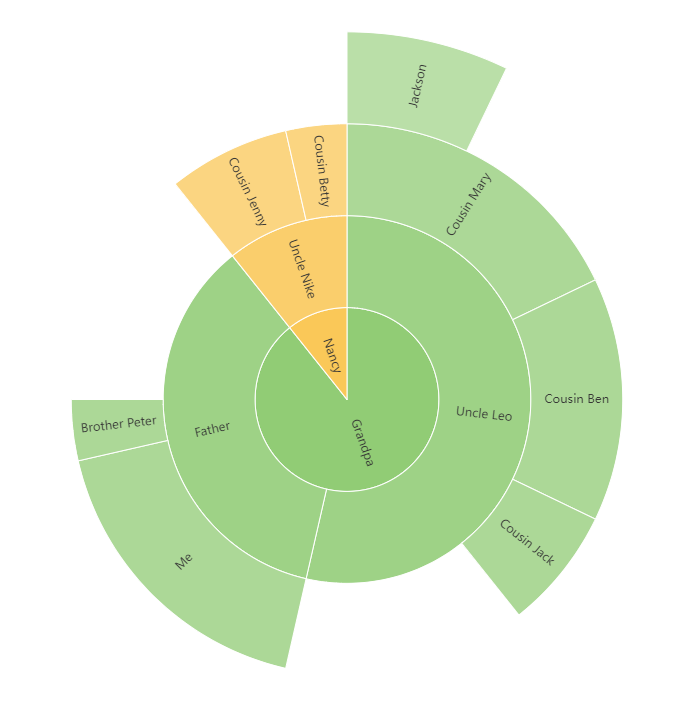
<template>
	<PgChart type="sunburst" cid="sunburst" :option="sunburstOption"></PgChart>
</template>

<script setup>
	let sunburstOption = {
    series: [
      {
        data: [
          {
            name: "Grandpa",
            children: [
              {
                name: "Uncle Leo",
                value: 15,
                children: [
                  {
                    name: "Cousin Jack",
                    value: 2,
                  },
                  {
                    name: "Cousin Mary",
                    value: 5,
                    children: [
                      {
                        name: "Jackson",
                        value: 2,
                      },
                    ],
                  },
                  {
                    name: "Cousin Ben",
                    value: 4,
                  },
                ],
              },
              {
                name: "Father",
                value: 10,
                children: [
                  {
                    name: "Me",
                    value: 5,
                  },
                  {
                    name: "Brother Peter",
                    value: 1,
                  },
                ],
              },
            ],
          },
          {
            name: "Nancy",
            children: [
              {
                name: "Uncle Nike",
                children: [
                  {
                    name: "Cousin Betty",
                    value: 1,
                  },
                  {
                    name: "Cousin Jenny",
                    value: 2,
                  },
                ],
              },
            ],
          },
        ],
      },
    ],
  }
</script>
parallel 平行坐标系:
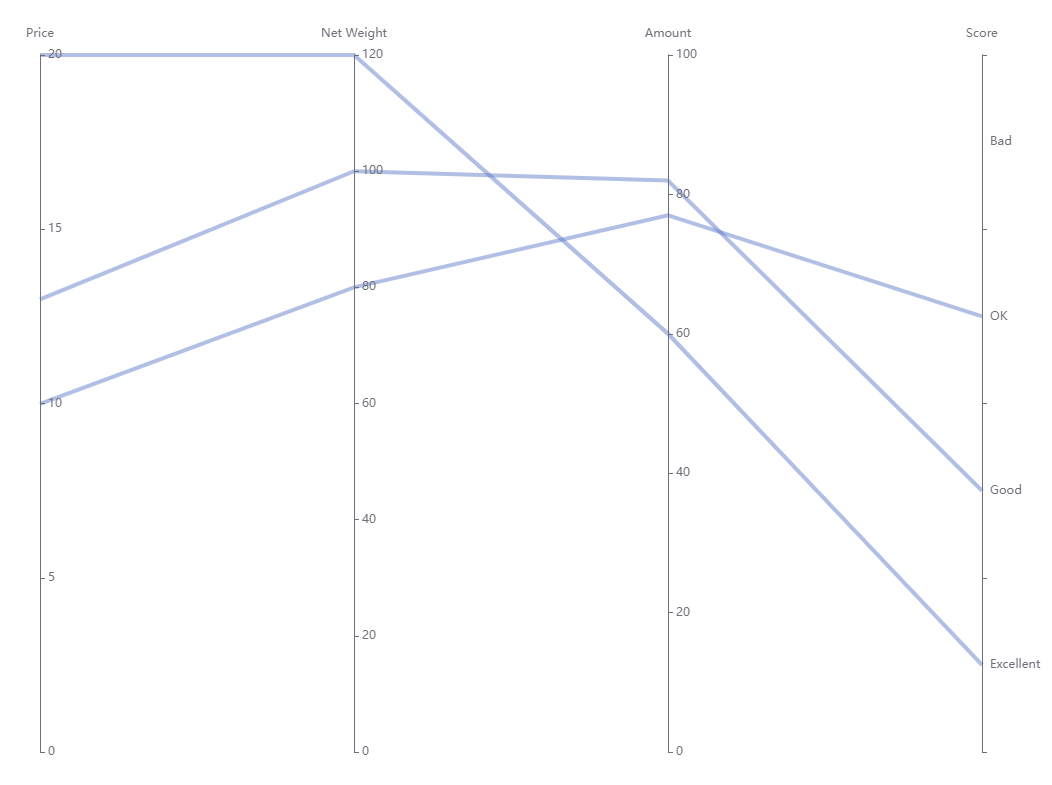
<template>
	<PgChart type="parallel" cid="parallel" :option="parallelOption"></PgChart>
</template>

<script setup>
	let parallelOption = {
    parallelAxis: [
      { dim: 0, name: 'Price' },
      { dim: 1, name: 'Net Weight' },
      { dim: 2, name: 'Amount' },
      {
        dim: 3,
        name: 'Score',
        type: 'category',
        data: ['Excellent', 'Good', 'OK', 'Bad']
      }
    ],
    series: [
      {
        data: [
          [12.99, 100, 82, 'Good'],
          [9.99, 80, 77, 'OK'],
          [20, 120, 60, 'Excellent']
        ]
      }
    }]
  }
</script>
sankey 桑基图:
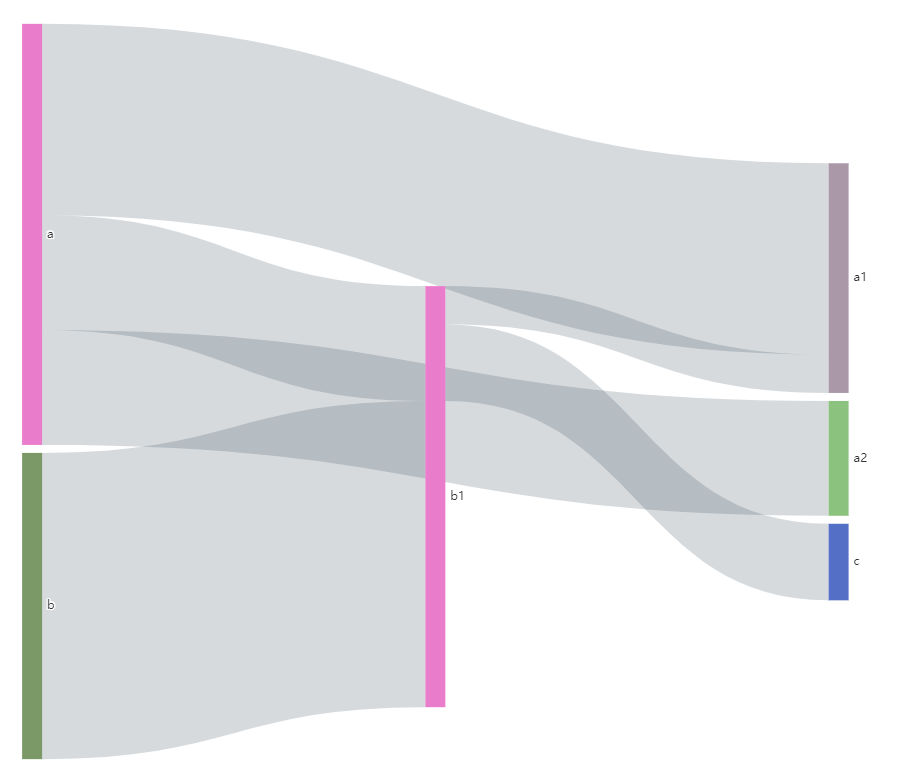
<template>
	<PgChart type="sankey" cid="sankey" :option="sankeyOption"></PgChart>
</template>

<script setup>
	let sankeyOption = {
    series: [
      {
        data: [
          {
            name: 'a'
          },
          {
            name: 'b'
          },
          {
            name: 'a1'
          },
          {
            name: 'a2'
          },
          {
            name: 'b1'
          },
          {
            name: 'c'
          }
        ],
        links: [
          {
            source: 'a',
            target: 'a1',
            value: 5
          },
          {
            source: 'a',
            target: 'a2',
            value: 3
          },
          {
            source: 'b',
            target: 'b1',
            value: 8
          },
          {
            source: 'a',
            target: 'b1',
            value: 3
          },
          {
            source: 'b1',
            target: 'a1',
            value: 1
          },
          {
            source: 'b1',
            target: 'c',
            value: 2
          }
        ]
      }
    ]
  }
</script>
funnel 漏斗图:
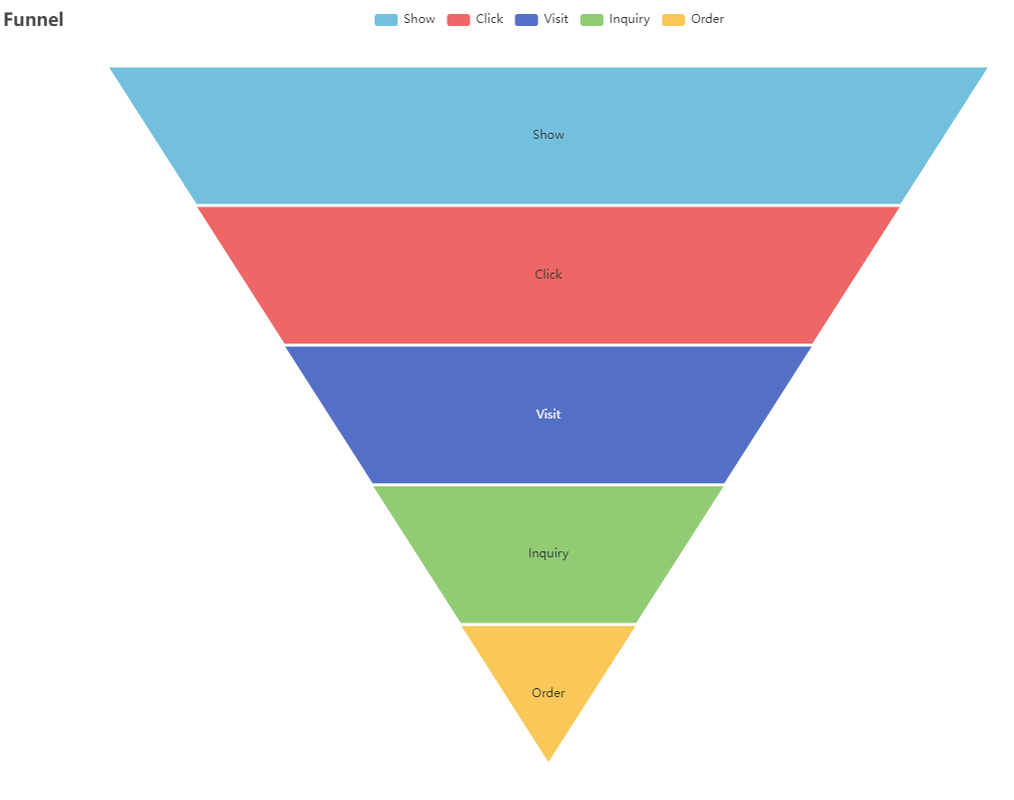
<template>
	<PgChart type="funnel" cid="funnel" :option="funnelOption"></PgChart>
</template>

<script setup>
	let funnelOption = {
    legend: {
      data: ['Show', 'Click', 'Visit', 'Inquiry', 'Order']
    },
    series: [
      {
        data: [
          { value: 60, name: 'Visit' },
          { value: 40, name: 'Inquiry' },
          { value: 20, name: 'Order' },
          { value: 80, name: 'Click' },
          { value: 100, name: 'Show' }
        ]
      }
    ]
  }
</script>