pixl-server-debug v1.0.1
- Overview Features Security
- Usage Globals Use With pixl-server-pool + Worker Globals
- User Interface Login Process List Debugger Started Log Controls
- Configuration enabled secret_key acl host * port
- License
Overview
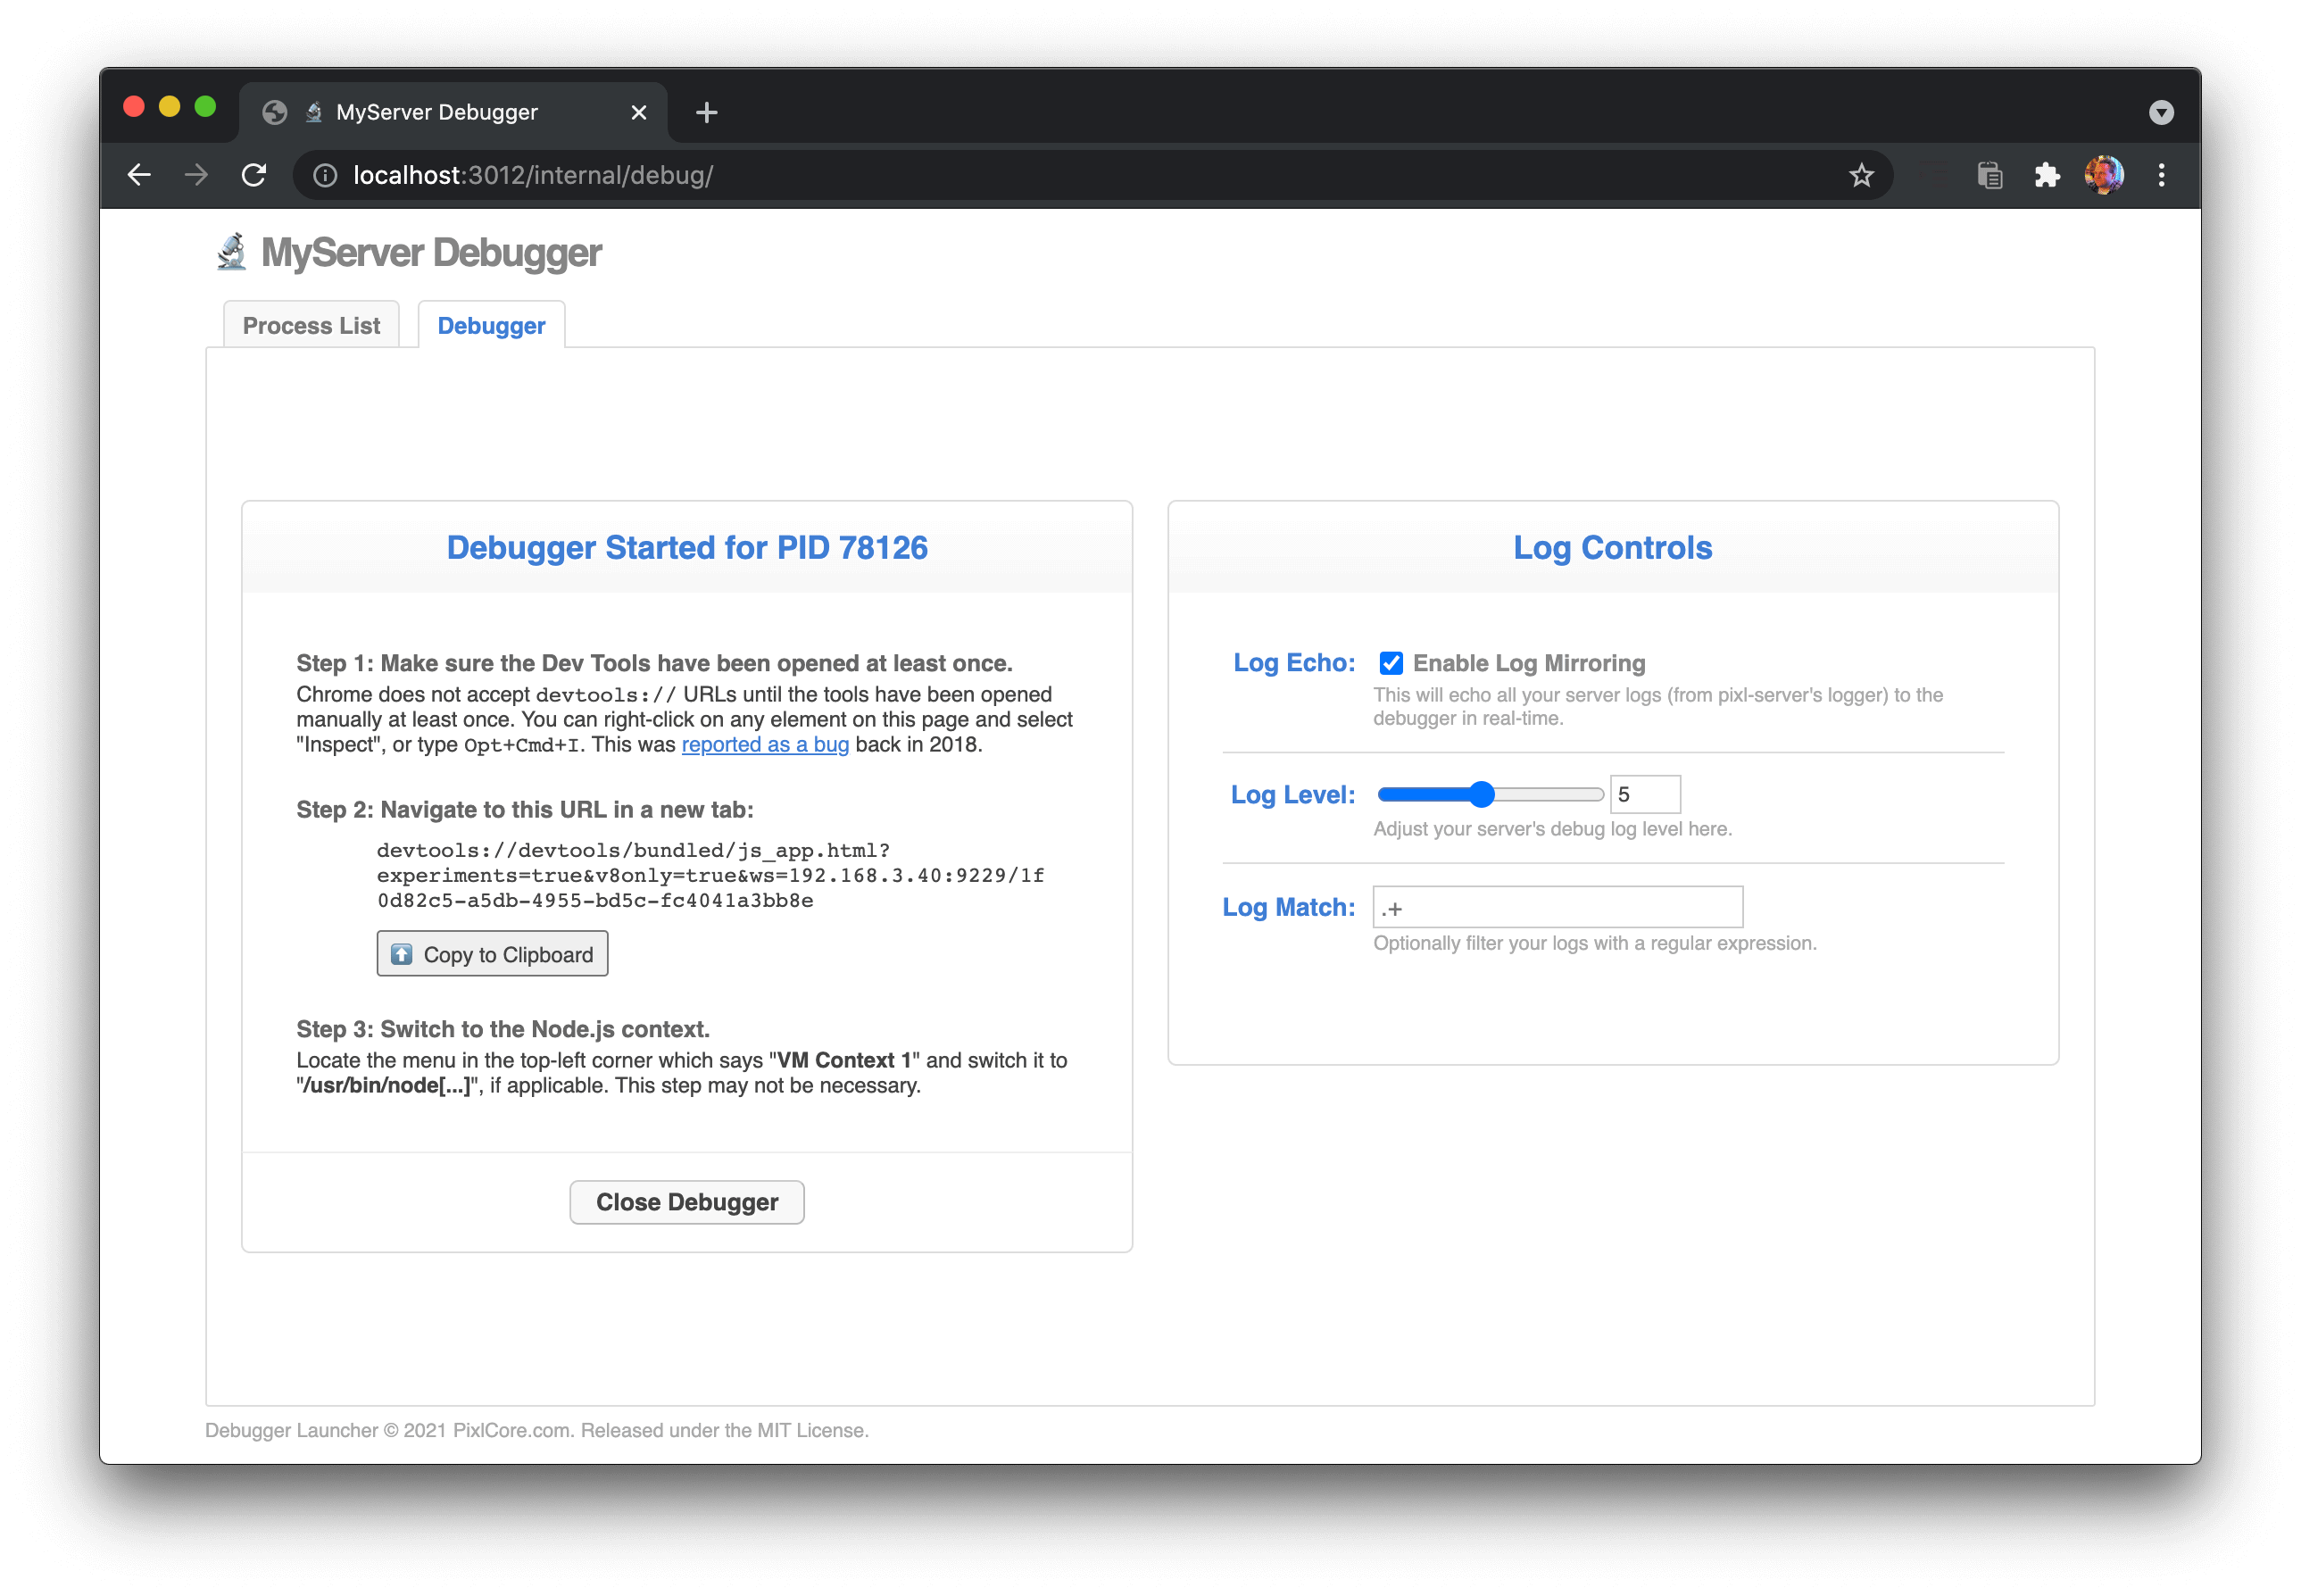
This module is a component for use in pixl-server. It allows you to easily attach the Chrome Developer Tools debugger UI to a running pixl-server process, even on a remote server, and even attach to a child process (if using pixl-server-pool). This is a very safe and secure system which restricts access behind several layers (see below).
Features
- Attach Chrome Dev Tools to a live running process on a remote server.
- Works with pixl-server-pool to attach to child worker processes.
- See live logs inside the Dev Tools console.
- Adjust log verbosity levels in real time.
- Filter logs for specific keywords (regex).
- Take V8 heap snapshots for memory leak analysis.
- Run the profiler to locate laggy functions.
- Set breakpoints and debug your code freely.
- Very secure and safe for use, even on production.
- Minimal footprint in application. - System runs as a separate component. - No debugger or listener active at startup. - No application slowdown under normal conditions. - Only a single URI handler is registered.
Security
Since attaching a debugger grants you virtually unlimited access to your application and server, security is extremely important. The debugger component offers the following protective layers:
- Access Control List protection
- Hostname/IP restriction
- Secret Key protection with: - SHA-256 challenge/response cryptographic hash exchange - Time-based auto-expiring nonce tokens - Secret key is never sent over the wire
- UUID authentication token for Dev Tools URL
- Automatic shutdown if user disappears
The first layer of protection is a simple ACL (Access Control List). You can specify a custom IP range list in your debugger configuration, or allow it to use the default pixl-server-web ACL.
The second layer is a hostname restriction for accessing the URI endpoint. It must exactly match the server's hostname or internal IP address (localhost is okay too). This is designed to block users who somehow cheat their way through the ACL. Without the actual server's hostname or IP on the URL, the debugger API will not function. Put another way, you cannot use your app's external public hostname (i.e. load balancer) to access the internal debugging APIs.
The third layer of protection is a secret key system. The secret key is known to the developer and the server, but is never sent over the wire between the two, in either direction. The implementation is a cryptographic hash challenge/response, with a time-based auto-expiring nonce token. The handshake works like this:
- User types in the secret key (it never leaves the browser).
- Client sends a "hello" API call to request a time-sensitive nonce token.
- Server sends back a nonce (assuming the client passes the ACL and hostname/IP protection).
- Client hashes the nonce with the secret key, generates a SHA-256 token, and sends that to the server along with the nonce.
- Server performs the same SHA-256 hash generation, and requires it to be exactly the same as the client's.
- Server also ensures the nonce is fresh and not expired (60 - 120 seconds).
- Then and only then does the server allow the API call to succeed, and the debugger to start.
This complicated exchange is designed to prevent outsiders from gaining access by looking at historical logs. No previous tokens or nonces will work, as they automatically expire after 1 - 2 minutes. This prevents all replay-style attacks. Note that a network MitM (man-in-the-middle) may gain access, unless the server implements SSL / HTTPS. But it is assumed that your servers are behind a firewall, and developers must be as well (hence layers 1 and 2). A MitM is not expected on an internal LAN.
Since the UI will likely need to send additional API requests to the server over time (for example, to change logging levels or to close the debugger), new nonces must be requested every minute. This process is handled automatically by the UI layer and JavaScript code running in the browser. The secret key remains in browser memory, and is used multiple times to generate new, fresh tokens as required.
The fourth layer of protection is the Dev Tools URL itself. Each time a debugger listener port is opened, a UUID token is generated, which must accompany the request to access the debugger websocket. This UUID is known only to the server and the authenticated UI. The UUID is sent to the browser only after the API request passes the first 3 layers, including the secret key hash authentication. Then and only then can the user activate the Chrome Dev Tools using the unique URL. Each UUID token may only be used once.
The fifth and final layer of protection is automatic shutdown on inactivity. If the user doesn't explicitly close the debugger, and instead just disappears (closes Chrome or it crashes), the server will automatically detect this after 5 minutes and shut down all debuggers and listeners.
Usage
Use npm to install the module and its dependencies.
npm install pixl-server pixl-server-web pixl-server-debugHere is a simple usage example. Note that the component's official name is Debug, so that is what you should use for the configuration key, and for gaining access to the component via your server object, should you need it.
var PixlServer = require('pixl-server');
var server = new PixlServer({

	__name: 'MyServer',
	__version: "1.0",

	config: {
		"log_dir": "/var/log",
		"debug_level": 9,

		"WebServer": {
			"http_port": 80,
			"http_htdocs_dir": "/var/www/html"
		},

		"Debug": {
			"enabled": true,
			"secret_key": "test1234"
		}
	},

	components: [
		require('pixl-server-web'),
		require('pixl-server-debug')
	]

});

server.startup( function() {
	// server startup complete
} );
Notice how we are loading the pixl-server parent module, and then specifying pixl-server-web and pixl-server-debug as components:
components: [
	require('pixl-server-web'),
	require('pixl-server-debug')
]
Once your application is up and running, simply navigate to the /internal/debug/ URI using Google Chrome, and provide your secret key to authenticate.
Globals
By default, the debugger will make your pixl-server instance available as a global named server, so it is accessible from inside the Dev Tools UI. You can, however, augment this with other objects you want exposed as globals, when the debugger activates. Here is an example:
server.Debug.addGlobals({
	myGlobal: myGlobal
});
The addGlobals() method expects an object, containing keys and values. This is merged into the Node.js global object when the debugger is started. All the globals added here are then removed when the debugger is stopped, including the server object.
Note that when you attach Chrome's Dev Tools, pixl-server-debug reminds you in the console which globals are available.
Use With pixl-server-pool
If your application uses pixl-server-pool for managing child processes, pixl-server-debug automatically detects this, and allows you to live debug your worker children as well. However, if you also want live log controls and log mirroring for your workers, you will have to attach your own pixl-logger agent on startup like this:
// in my_worker.js
const Logger = require('pixl-logger');

exports.startup = function(worker, callback) {
	// child is starting up, save reference to worker
	this.worker = worker;

	// setup our own logger
	var columns = ['hires_epoch', 'date', 'hostname', 'pid', 'component', 'category', 'code', 'msg', 'data'];
	this.logger = new Logger( 'logs/worker.log', columns );

	// attach logger to worker
	this.worker.attachLogAgent( this.logger );

	callback();
};
This allows pixl-server-debug to control your worker's logger instance, enable mirroring, filtering, and adjust the debug level in real-time.
Worker Globals
The Globals situation is slightly different in worker processes. Since there is no pixl-server instance, the worker singleton from pixl-server-pool is exposed instead. Also, your application itself (your worker code) is exposed as a global app variable.
You can also add your own globals for debugging in worker processes. The API is available via the worker object (which is passed to your startup() function):
this.worker.addDebugGlobals({
	myGlobal: myGlobal
});
The addDebugGlobals() method expects an object, containing keys and values. This is merged into the Node.js global object when the debugger is started in the worker. All the globals added here are then removed when the debugger is stopped, including the worker and app objects.
User Interface
Login
When you first point your Google Chrome web browser at your application's server and port using the /internal/debug/ URI, you are presented with a login form:
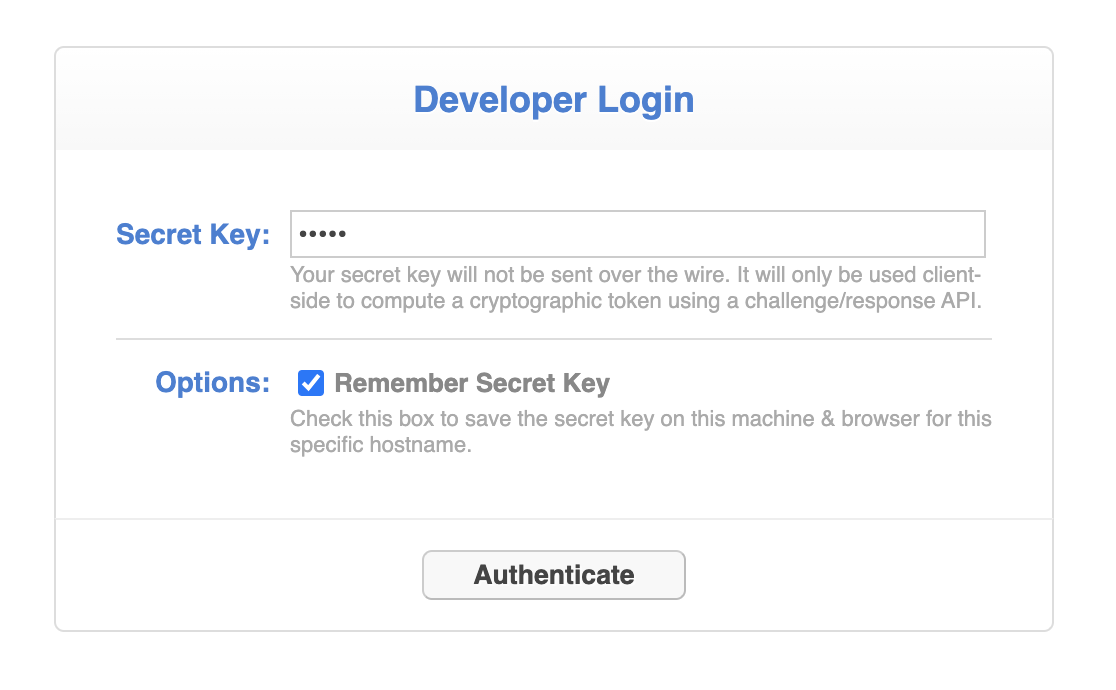
This is where you enter your secret key, which you previously set in your app's configuration file. Note that the secret key is never sent over the wire. Instead, it is used to facilitate a cryptographic hash challenge/response with the server.
You can also choose to "remember" the secret key here, which basically just throws it into your browser's localStorage DB. This is insecure, so do this at your own risk.
Process List
Once you are successfully authenticated, you will be presented with a list of the available processes to debug:
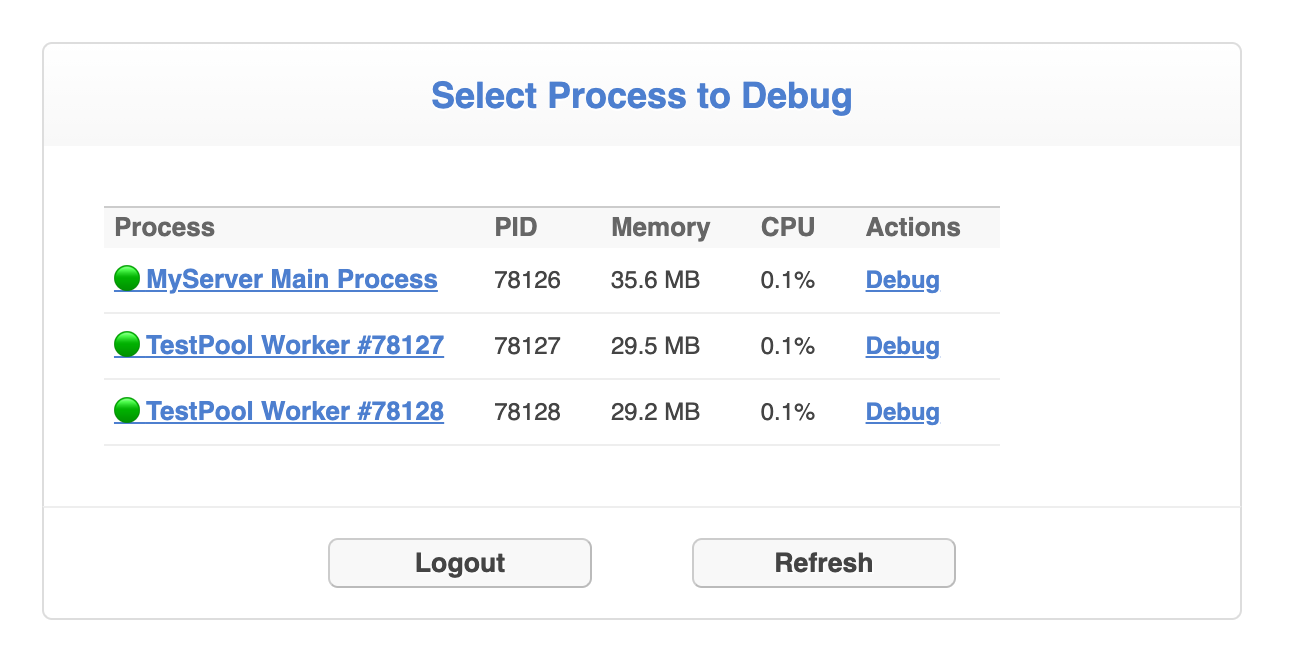
If you are using pixl-server-pool, this list will include all child worker processes, as well as the parent daemon process. Click on the process you wish to debug.
Debugger Started
Once you have clicked on a process, the debugger is started on the server-side, and you are presented with instructions for activating Chrome's Dev Tools to attach the debugger UI:
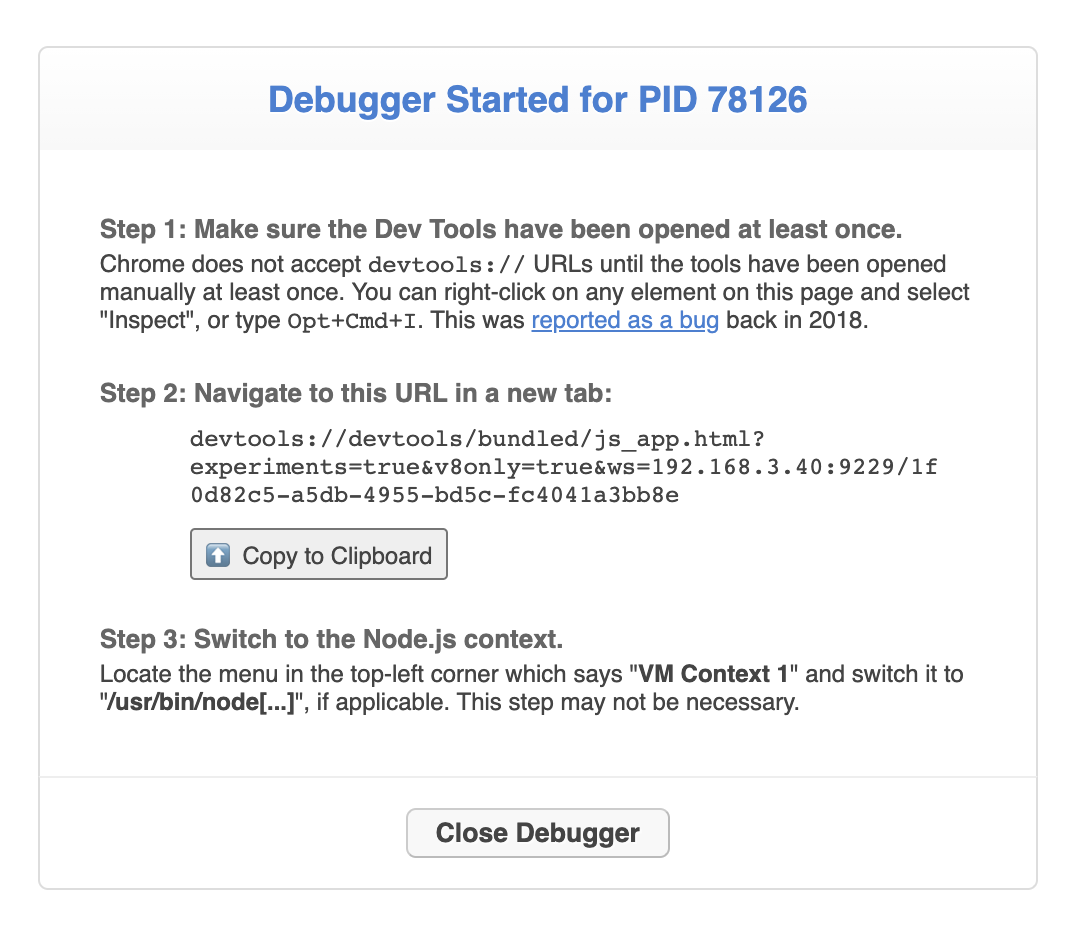
Due to security limitations in Chrome, a web application cannot redirect you to a devtools:// URL, nor can it programmatically open a Dev Tools window or tab using JavaScript. So the only thing we can do here is display your unique, authenticated Dev Tools URL for your selected process, and provide you with a copy-to-clipboard button. It is then up to you to open a new browser tab and paste the URL into it.
Click the "Close Debugger" button when you are done debugging. This shuts down the debugger listener on the server-side. If you accidentally forget to hit this button and just close the browser window, the debugger listener will automatically shut itself down after 5 minutes.
Log Controls
On the right side of the screen you will find some logging controls:
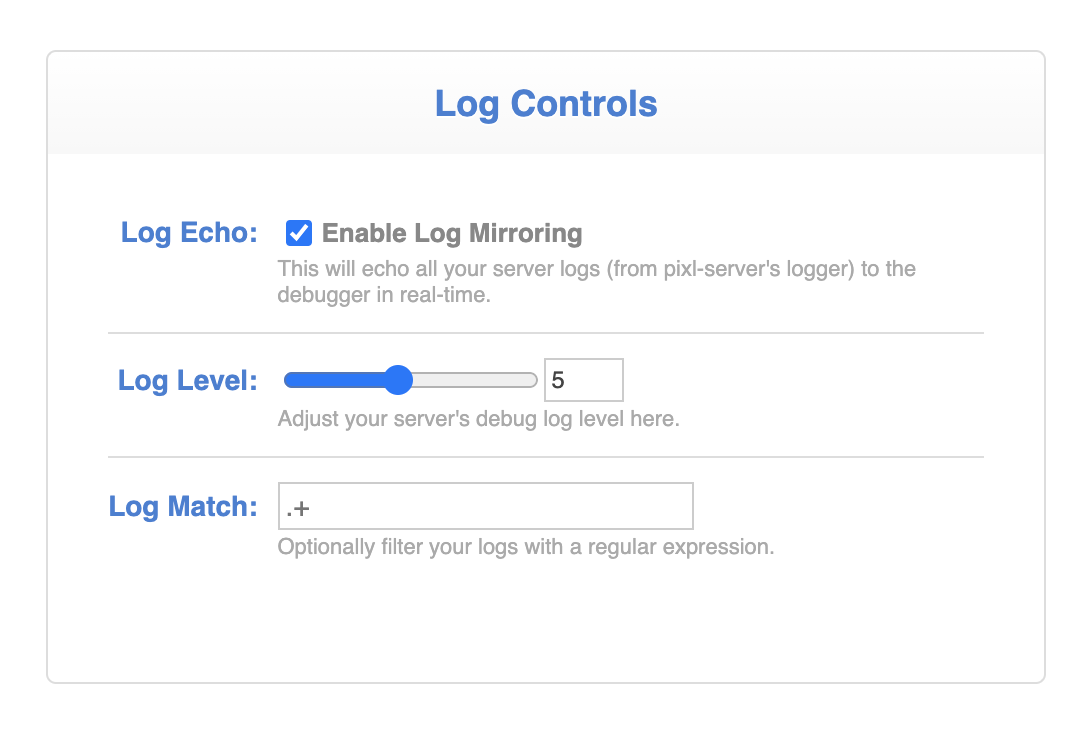
Here you can enable or disable "log mirroring", which streams your main log to the Chrome Dev Tools console tab in real-time. For the parent process, this is the pixl-server log. For pixl-server-pool this is whatever pixl-logger-compatible instance you passed to attachLogAgent().
You can also adjust the debug logging level here, by selecting a value from 1 to 10 on the range slider. Note that this controls the debug log level of your actual server log files on disk, as well as the log mirror. When you close the debugger, this is automatically reset to its original level.
Finally, you can optionally enter an regular expression here, to filter the log mirror. This is useful if you only want to see log entries for a particular component, or rows containing a particular phrase. This only affects the contents of the log mirror, not your server log files on disk.
All of these UI controls are "live", meaning they react in real-time, the moment they are changed.
Configuration
The configuration for this component is set by passing in a Debug key in the config element when constructing your pixl-server instance, or, if a JSON configuration file is used, a Debug object at the outermost level of the file structure. Example:
"Debug": {
	"enabled": true,
	"secret_key": "test1234",
	"acl": true,
	"host": "0.0.0.0",
	"port": 9229
}
See below for descriptions of each property.
enabled
| Name | Type | Default | Required |
|---|---|---|---|
enabled | Boolean | false | Yes |
This is the master switch for the debugger component. If this is set to false (which is the default), then the entire system is disabled. As an extra security precaution, you can optionally ship your app with this disabled, and then only enable it on-demand as live debugging sessions are required. pixl-server will automatically hot-reload its configuration file, so you can enable / disable the debugger without requiring a restart.
secret_key
| Name | Type | Default | Required |
|---|---|---|---|
secret_key | String | "" | Yes |
This is where you store the secret key for authenticating users in the debugger UI. It is also recommended that you chmod your configuration file so that only root can read/write it, i.e. 0600. That way if an attacker gains access to your server via SSH as an underprivileged user, they will not be able to view your secret key.
acl
| Name | Type | Default | Required |
|---|---|---|---|
acl | Mixed | true | No |
Here you can customize the ACL (Access Control List) for allowing IP ranges to access the debugger. By default this will use the default pixl-server-web ACL, but you can customize it by specifying an array of IPv4 and/or IPv6 addresses, partials or CIDR blocks. Example:
"Debug": {
	"enabled": true,
	"secret_key": "test1234",
	"acl": ['127.0.0.1', '10.0.0.0/8', '172.16.0.0/12', '192.168.0.0/16', '::1/128', 'fd00::/8', '169.254.0.0/16', 'fe80::/10']
}
The three values accepted for the acl property are:
true, which is the default and will use the default pixl-server-web ACL,false, which will disable the ACL entirely (not recommended), or- an array of custom IP ranges (shown above).
host
| Name | Type | Default | Required |
|---|---|---|---|
host | String | "0.0.0.0" | No |
This allows you to customize the network interfaces upon which to allow the Node.js debugger websocket. By default this is set to "0.0.0.0" which means listen on all network interfaces. You can set this to a specific network interface IP if you'd like, for extra security.
It should be noted that the Node.js built-in default for the inspector module is to only listen on the localhost loopback adapter (i.e. 127.0.0.1), but this won't work for pixl-server-debug because the whole point is to allow remote debugging on an external server.
port
| Name | Type | Default | Required |
|---|---|---|---|
port | Number | 9229 | No |
Here you can customize the port used to open the Node.js debugger websocket. It defaults to 9229 which is the Node.js default value. There should be no reason to ever change this unless your servers use this port for other services.
License
The MIT License (MIT)
Copyright (c) 2021 Joseph Huckaby.
Permission is hereby granted, free of charge, to any person obtaining a copy of this software and associated documentation files (the "Software"), to deal in the Software without restriction, including without limitation the rights to use, copy, modify, merge, publish, distribute, sublicense, and/or sell copies of the Software, and to permit persons to whom the Software is furnished to do so, subject to the following conditions:
The above copyright notice and this permission notice shall be included in all copies or substantial portions of the Software.
THE SOFTWARE IS PROVIDED "AS IS", WITHOUT WARRANTY OF ANY KIND, EXPRESS OR IMPLIED, INCLUDING BUT NOT LIMITED TO THE WARRANTIES OF MERCHANTABILITY, FITNESS FOR A PARTICULAR PURPOSE AND NONINFRINGEMENT. IN NO EVENT SHALL THE AUTHORS OR COPYRIGHT HOLDERS BE LIABLE FOR ANY CLAIM, DAMAGES OR OTHER LIABILITY, WHETHER IN AN ACTION OF CONTRACT, TORT OR OTHERWISE, ARISING FROM, OUT OF OR IN CONNECTION WITH THE SOFTWARE OR THE USE OR OTHER DEALINGS IN THE SOFTWARE.