1.0.2 • Published 6 years ago
react-butterfly-chart v1.0.2
react-butterfly-chart
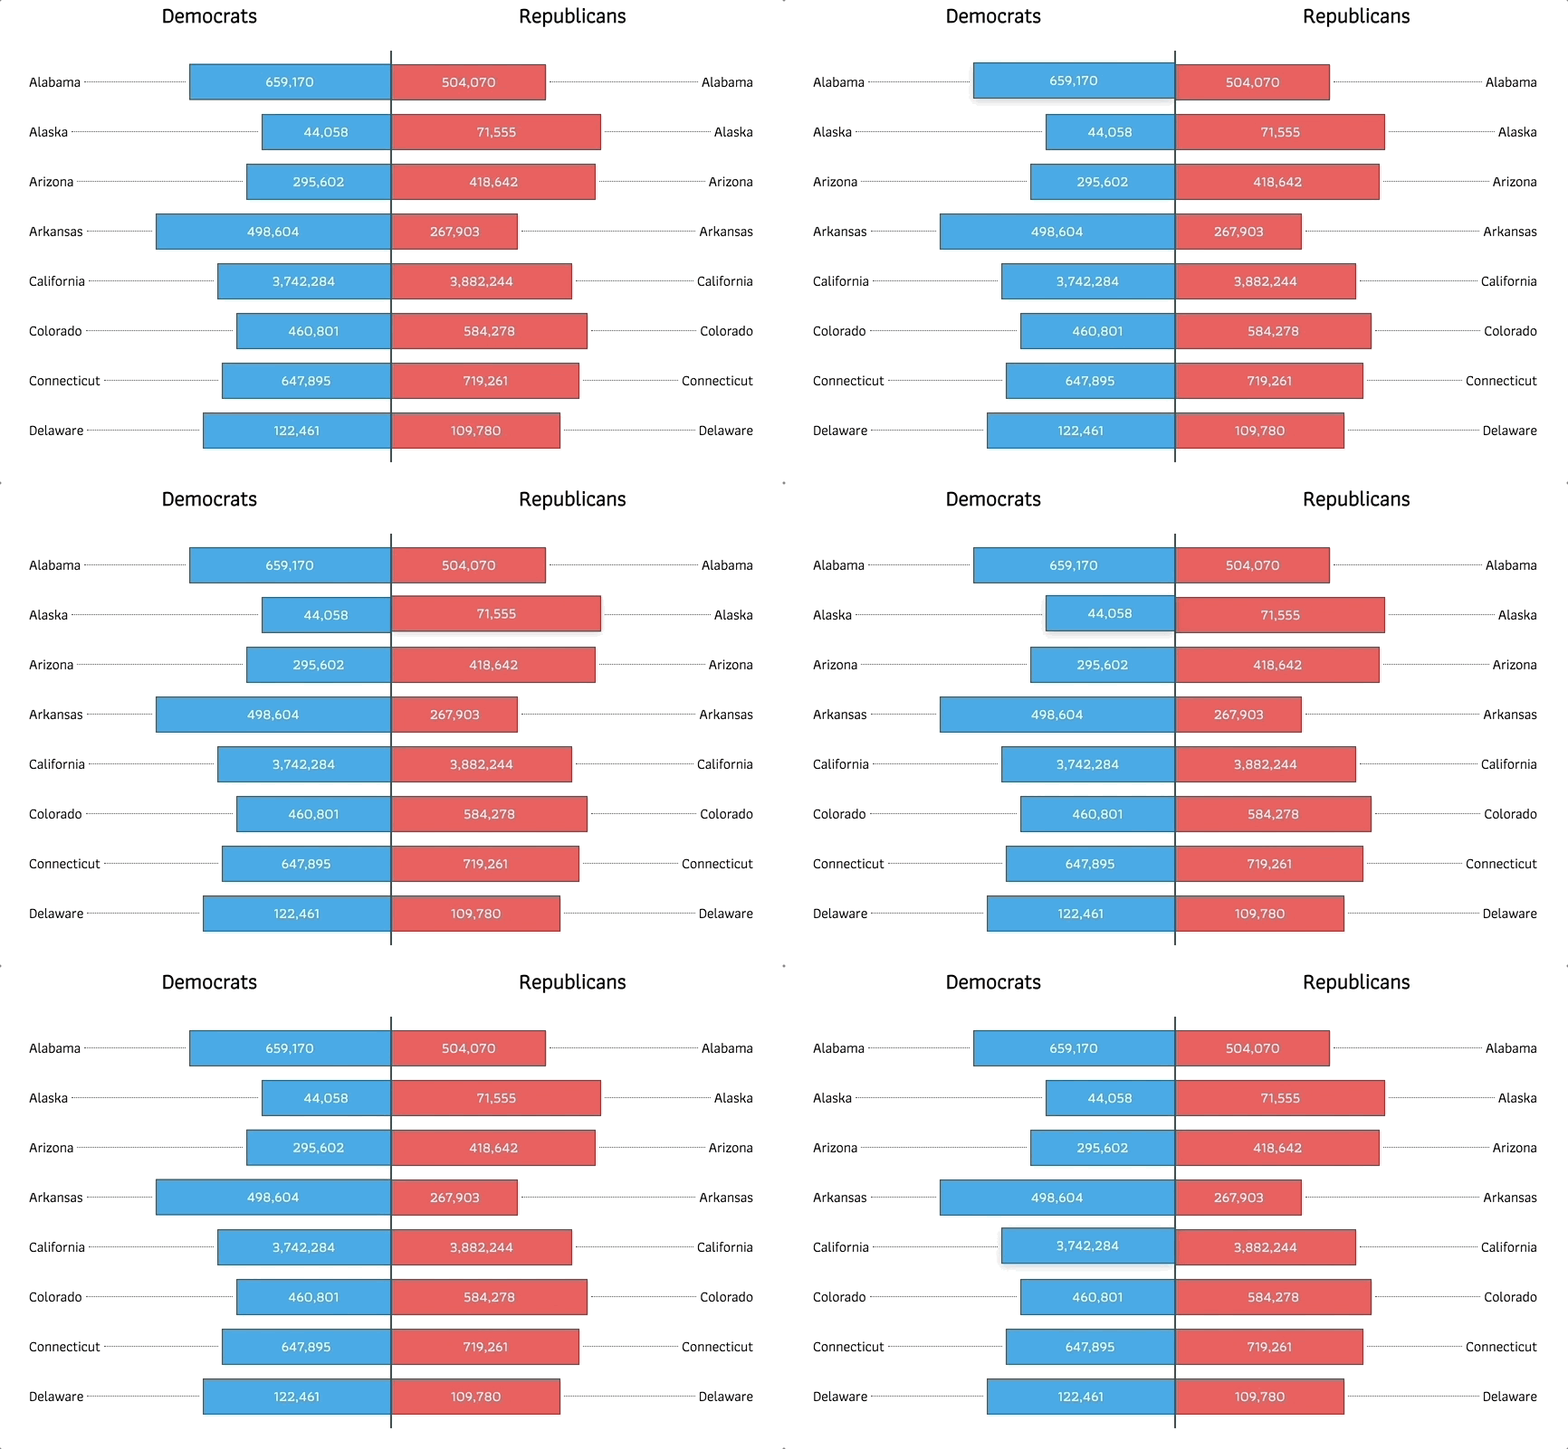
React Butterfly Chart allows you to make a simple, elegant butterfly chart component.
Butterfly Charts are best suited for comparing two groups with the same paramaters, like election results or population data.
Demo
View live Demo

Installation
npm install react-butterfly-chartExample use
<ButterflyChart
    titleLeft="Democrats"
    titleRight="Republicans"
    leftData={leftElectionData}
    rightData={rightElectionData}
    labelField="state"
    dataField="candidatevotes"
    leftColor="#2AA1EC"
    rightColor="#FE6A59"
/>
Props
titleLeft- title that appears on the left side of the charttitleRight- title that appears on the right side of the chartleftData- data that appears on the left side of the chartrightData- data that appears on the left side of the chartlabelField- field that will be used to label individual barsdataField- field that will be used to label individual barsleftColor- hexcolor for left barsrightcolor- hexcolor for right bars
Data should be provided as an object in "row" format and always include a percentage field that the component will use to determine the width of the bar. percentage field should be provided as an integer. label and data fields should be passed in the format that you want displayed. For example:
data = {
    "0":{
        "group": "81-100",
        "population": "30M",
        "percentage": "40",
    },
    "1":{
        "group": "41-60",
        "population": "45M",
        "percentage": "30",
    }
}
Take care to provide an equal number of rows to each side.
License
This project is licensed under the MIT License.