1.3.0 • Published 4 years ago
react-human-chart v1.3.0
React Human Chart
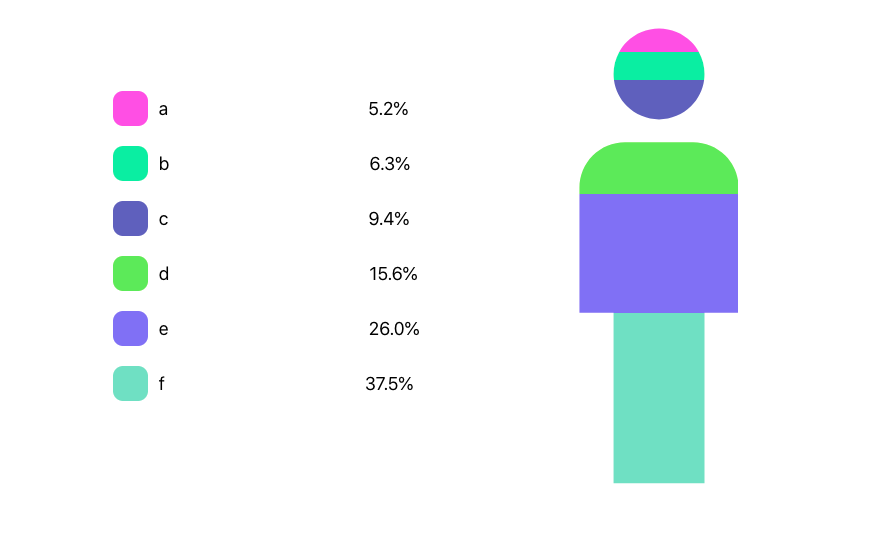
A simple human chart made with create-react-app that displays percentages of input data.
Table of Contents
General Information
- The HumanChart component receives an input dataset and a dataKey to calculate the percentages of these data on the human chart
Technologies Used
- Typescript - version 4.1.2
- React - version 17.0.2
Screenshots

Setup
Install the library using
npm i react-human-chart
Usage
How to use it?
We import the library normally in our component
import { HumanChart } from "react-human-chart"
We provide the component with these props
| prop | type | required | description |
|---|---|---|---|
| dataKey | string | Yes | The name of the key in the input dataset to calculate the percentages from. Its value can be a numeric string or a number. |
| labelKey | string | No | The name of the key in the input dataset for the value labels of each percentages. Its default value is "name". |
| customColors | boolean | No | A flag indicating if you want to add your custom colors to each record in the dataset. For that, you have to provide a color prop to each record in the dataset containing a hex color string. Its default value is false and random colors are generated for each portion. |
| data | { key: string: string | number }[] | Yes | The input dataset to calculate the percentages from. Its values can be numeric strings or numbers. |
<HumanChart data={data} dataKey="foo" />
Room for Improvement
- Multiple new animations
- Allowing for custom styles
- Responsive chart
Acknowledgements
Give credit here.
- This project was based on this article.
Contact
Created by kizofcb - feel free to contact me!