0.1.1 • Published 2 years ago
react-native-c5 v0.1.1
react-native-c5
a small library to host charts
Installation
npm install react-native-c5Basic Chart
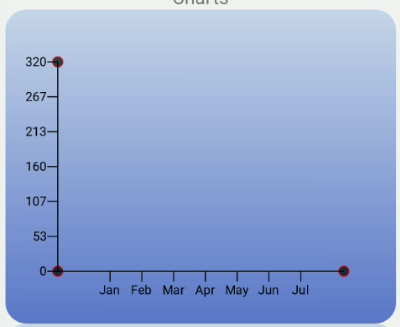
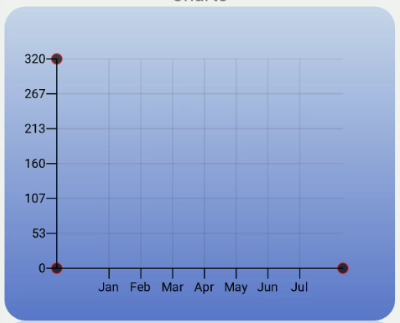
Line Chart
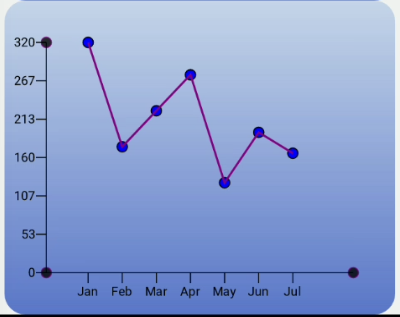
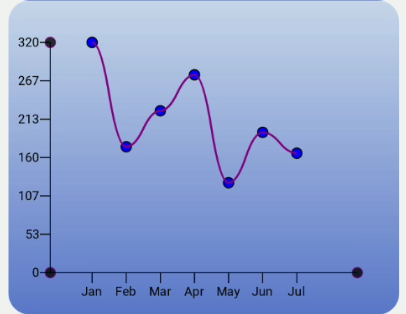
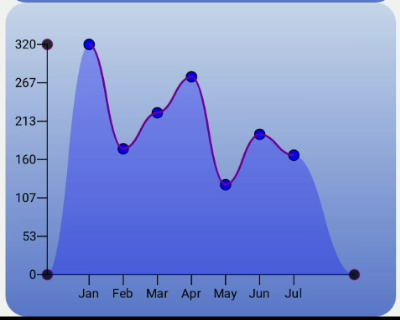
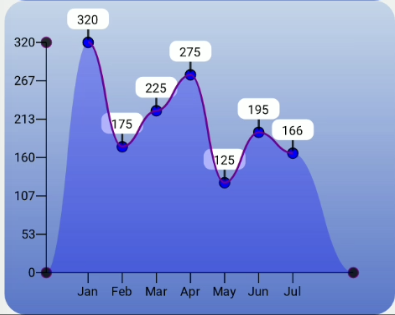
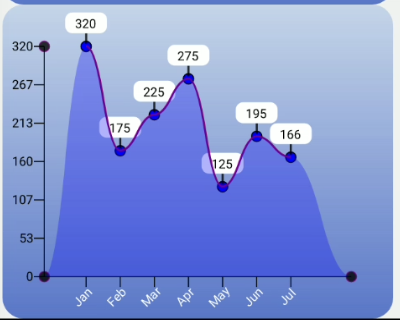
Usage
The usage for all the charts is basically the same.
import {LineChart} from '.react-native-c5';

<LineChart
  data={testData}
  x_key="month"
  y_key="value"
  height={300}
  margin={40}
  y_label_renderer={yRenderer}
/>
Props
| Prop name | optional | type | description | default |
|---|---|---|---|---|
| data | required | array | array of data | |
| x_key | required | string | field to use for the x axis | |
| y_key | required | string | field to use for the Y axis | |
| onPressItem | ✔ | function | returns the item that was clicked | |
| height | ✔ | number | height of the chart | |
| width | ✔ | number | width of the chart | |
| axisWidth | ✔ | number | width of axis lines | 2 |
| axisColor | ✔ | color | color of axis lines | #fff |
| axisCircleColor | ✔ | color | border circles of axis color | #fff |
| axisCircleRadius | ✔ | number | radius of border circles on the axis | 5 |
| curve | ✔ | boolean | use bezier curve for the chart line | true |
| lineCircleStroke | ✔ | color | chart line circle stroke color | #fff |
| lineCircleFill | ✔ | color | chart line circle color fill value | transparent |
| lineCircleStrokeWidth | ✔ | number | thickness of chart line circles | 2 |
| lineCircleRadius | ✔ | number | radius of chart line circles | 5 |
| lineStrokeWidth | ✔ | number | thickneess of chart line | 5 |
| lineStroke | ✔ | color | color of chart line | 'blue' |
| useLineShadow | ✔ | boolean | use gradient overlay under line chart | true |
| useBackgroundGradient | ✔ | boolean | use Background gradient for svg chart | true |
| verticalLines | ✔ | boolean | show Vertical lines | false |
| verticalLineOpacity | ✔ | number | opacity of vertical lines | 0.2 |
| horizontalLines | ✔ | boolean | show Horizontal lines | false |
| horizontalLineOpacity | ✔ | number | opacity of horizontal lines | 0.2 |
| showTooltips | ✔ | boolean | show tooltips on chart | false |
| y_label_renderer | ✔ | function | function to custom render the y labels | |
| x_label_renderer | ✔ | function | function to custom render the x labels |
x_axis_label_config Props
| Prop name | optional | type | description | default |
|---|---|---|---|---|
| rotation | ✔ | number | degrees of rotation for labels | 0 |
| fontSize | ✔ | number | font size of labels | 15 |
| fontColor | ✔ | color | color of labels | '#fff' |
| textAnchor | ✔ | string | anchor property of label | 'middle' |
| fontWeight | ✔ | string | font weight of label | '400' |
y_axis_label_config Props
| Prop name | optional | type | description | default |
|---|---|---|---|---|
| rotation | ✔ | number | degrees of rotation for labels | 0 |
| fontSize | ✔ | number | font size of labels | 15 |
| fontColor | ✔ | color | color of labels | '#fff' |
| textAnchor | ✔ | string | anchor property of label | 'middle' |
| fontWeight | ✔ | string | font weight of label | '400' |
tooltip_config Props
| Prop name | optional | type | description | default |
|---|---|---|---|---|
| tooltipHeight | ✔ | number | height of tooltips | 20 |
| tooltipWidth | ✔ | number | width of tooltips | 40 |
| tooltipFill | ✔ | color | background of tooltip | '#fff' |
| tooltipBorderRadius | ✔ | number | border radius of tooltips | 7 |
| fontSize | ✔ | number | fontSize for tooltip text | 12 |
| fontWeight | ✔ | string | font weight for tooltip text | '400' |
| textAnchor | ✔ | string | anchor point for text | 'middle' |
line_fill_gradient_config Props
this config only has 2 props (stop1, stop2)
| Prop name | optional | type | description | default |
|---|---|---|---|---|
| offset | ✔ | number | gradient offset | 0 |
| stopColor | ✔ | color | color for gradient point | |
| stopOpacity | ✔ | number | opacity for the gradient stop |
background_gradient_config Props
there are 4 stop points that can be configured the same as the line_fill_gradient_config stops
| Prop name | optional | type | description | default |
|---|---|---|---|---|
| gradientUnits | ✔ | string | 'useSpaceOnUse' | |
| x1 | ✔ | number | 0 | |
| y1 | ✔ | number | 0 | |
| x2 | ✔ | number | 0 | |
| y2 | ✔ | number | 0 |
sample LineChart config that is available:
const {
      onPressItem,
      height: containerHeight = 300,
      width: containerWidth = SCREEN_WIDTH - 50,
      backgroundColor = 'transparent',
      svgBackgroundColor = 'transparent',
      useGradientBackground = true,
      backgroundBorderRadius = 20,
      axisCircleRadius = 5,
      axisColor = '#000',
      axisCircleFillColor = '#000',
      axisCircleStrokeColor = 'purple',
      axisStrokeWidth = 1,
      axisCircleOpacity = 0.8,
      showHorizontalLines = false,
      horizontalLineOpacity = 0.1,
      showVerticalLines = false,
      verticalLineOpacity = 0.1,
      lineCircleRadius = 5,
      lineCircleStroke = '#000',
      lineCircleStrokeWidth = 1,
      lineCircleFill = 'blue',
      showTooltips = true,
      lineStrokeWidth = 2,
      lineStroke = 'purple',
      curve = true,
      useLineShadow = true,
      x_label_renderer,
      y_label_renderer,
      gradient_background_config = {
        x1: 0,
        y1: 0,
        x2: 0,
        y2: containerHeight,
        stop1: {
          offset: 0,
          stopColor: '#6491d9',
          stopOpacity: 0.3,
        },
        stop2: {
          offset: 1,
          stopColor: '#3557bf',
          stopOpacity: 0.8,
        },
      },
      x_axis_config = {
        fontSize: 12,
        textAnchor: 'middle',
        fontColor: '#fff',
        fontWeight: '400',
        rotation: -45,
      },
      y_axis_config = {
        fontSize: 12,
        textAnchor: 'end',
        fontColor: '#000',
        fontWeight: '400',
        rotation: 0,
      },
      tooltip_config = {
        tooltipHeight: 20,
        tooltipWidth: 40,
        tooltipFill: '#fff',
        tooltipBorderRadius: 7,
        fontSize: 12,
        fontWeight: '400',
        textAnchor: 'middle',
      },
    } = this.props;
Bar Chart
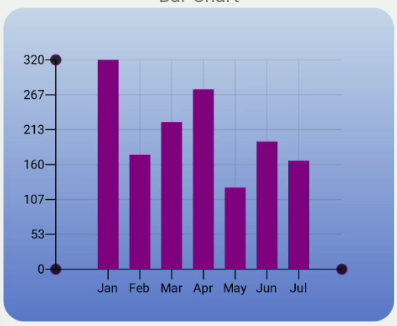
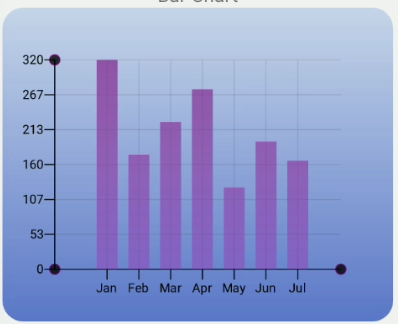
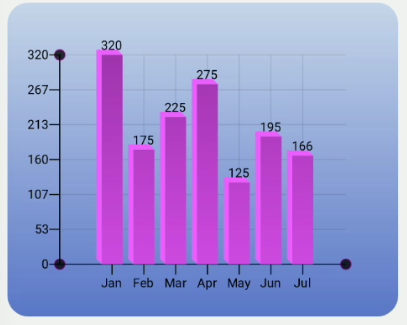
sample config for BarChart
const {
      onPressItem,
      height: containerHeight = 300,
      width: containerWidth = SCREEN_WIDTH - 50,
      backgroundColor = 'transparent',
      svgBackgroundColor = 'transparent',
      backgroundBorderRadius = 20,
      axisCircleRadius = 5,
      axisColor = '#000',
      axisCircleFillColor = '#000',
      axisCircleStrokeColor = 'purple',
      axisStrokeWidth = 1,
      axisCircleOpacity = 0.8,
      showHorizontalLines = true,
      horizontalLineOpacity = 0.1,
      showVerticalLines = true,
      verticalLineOpacity = 0.1,
      useBarGradient = true,
      threeD = true,
      threeDX = 5,
      threeDY = 5,
      x_label_renderer,
      y_label_renderer,
      barColor = 'purple',
      barOpacity = 1,
      barWidth = 20,
      animated = true,
      gradient_background_config = {
        x1: 0,
        y1: 0,
        x2: 0,
        y2: containerHeight,
        stop1: {
          offset: 0,
          stopColor: '#6491d9',
          stopOpacity: 0.3,
        },
        stop2: {
          offset: 1,
          stopColor: '#3557bf',
          stopOpacity: 0.8,
        },
      },
      bar_gradient_config = {
        x1: 0,
        y1: 0,
        x2: 0,
        y2: containerHeight,
        stop1: {
          offset: 0,
          stopColor: '#7e248a',
          stopOpacity: 0.8,
        },
        stop2: {
          offset: 1,
          stopColor: '#b92bcc',
          stopOpacity: 0.3,
        },
      },
      x_axis_config = {
        fontSize: 12,
        textAnchor: 'middle',
        fontColor: '#000',
        fontWeight: '400',
        rotation: 0,
      },
      y_axis_config = {
        fontSize: 12,
        textAnchor: 'end',
        fontColor: '#000',
        fontWeight: '400',
        rotation: 0,
      },
      showTooltips = true,
      tooltip_config = {
        fontColor: '#000',
        fontSize: 12,
        fontWeight: '400',
        textAnchor: 'middle',
      },
    } = this.props;
BoxPlot
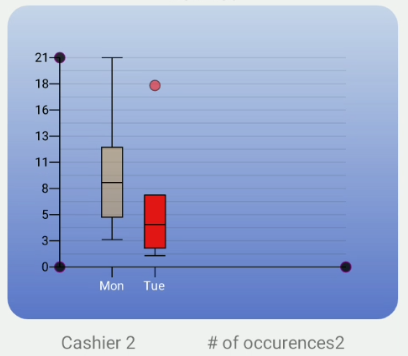
the boxplot chart also exposes some other useful helper functions
- asc
- desc
- sum
- max
- min
- range
- mean
- median
- quartile
- IQR
- Outliers
- maxWithoutOutliers
- minWithoutOutliers
- unique
export interface BoxPlotPress<T> {
  record: string;
  q1: number;
  q3: number;
  index: number;
  x: number;
  m: number;
  outliers: number[];
  maxwo: number;
  minwo: number;
  dayData: any;
  predicateResult: T[] | null;
}

export interface BoxPlotProps<T> {
  barWidth?: number;
  animated?: boolean;
  barColor?: string;
  barOpacity?: number;
  bar_gradient_config?: ILinearGradient;
  predicate_gradient_config?: ILinearGradient;
  skipYAxisLabels?: number;
  barStroke?: string;
  barStrokeWidth?: number;
  useBarGradient?: boolean;
  medianStroke?: string;
  medianStrokeWidth?: number;
  upperLineStroke?: string;
  upperLineStrokeWidth?: number;
  upperboxStroke?: string;
  upperboxStrokeWidth?: number;
  lowerLineSroke?: string;
  lowerLineStrokeWidth?: number;
  lowerboxStroke?: string;
  lowerboxStrokeWidth?: number;
  onPress?: (record: BoxPlotPress<T>) => void;
  predicateResult?: (item: T) => T[] | [];
  outlier_config?: IOutlier;
}

export interface IOutlier {
  radius?: number;
  stroke?: string;
  strokeWidth?: number;
  opacity?: number;
  fill?: string;
}
MultiLine
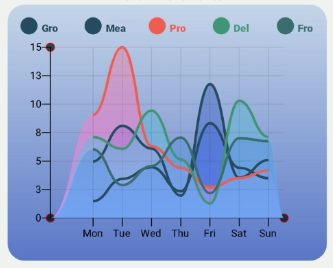
In order to use this chart, you have to separate your data. We have supplied a function that you can use for this:
const colors = [
  '#81968f',
  '#ecb0e1',
  '#de6c83',
  '#c1aac0',
  '#2cf6b3',
  '#87255b',
];

const separated = separateData(promarData, 'f01', colors);
here we are creating each array based off the 'f01' key of the data specified. Each of these arrays will become each line.
Contributing
See the contributing guide to learn how to contribute to the repository and the development workflow.
License
MIT
Made with create-react-native-library
shoutouts
0.1.1
2 years ago


